Agronometrics in Charts: Kiwifruit prices high compared to previous seasons


In this installment of the ‘Agronometrics In Charts’ series, Cristian Crespo illustrates how the U.S. market is evolving. Each week the series looks at a different horticultural commodity, focusing on a specific origin or topic visualizing the market factors that are driving change.


This week we will see how kiwifruit prices in the U.S. market have been doing and compare them to prices of previous seasons.
These days, kiwifruit (it should be noted that we are talking about the Hayward variety), are reporting the highest prices of the last five seasons, which we will show in this article and also mention the possible causes that are creating this rise.
As we see from the graph below, kiwifruit prices were the highest of recent seasons between week 43 of 2020 and week 2 of 2021.
In week 49 of 2020, kiwifruit reported the highest price for a week in comparison to the last years, reaching an average price of US$2.75 per kg.
Price of kiwis in the U.S. market (USD/kg)
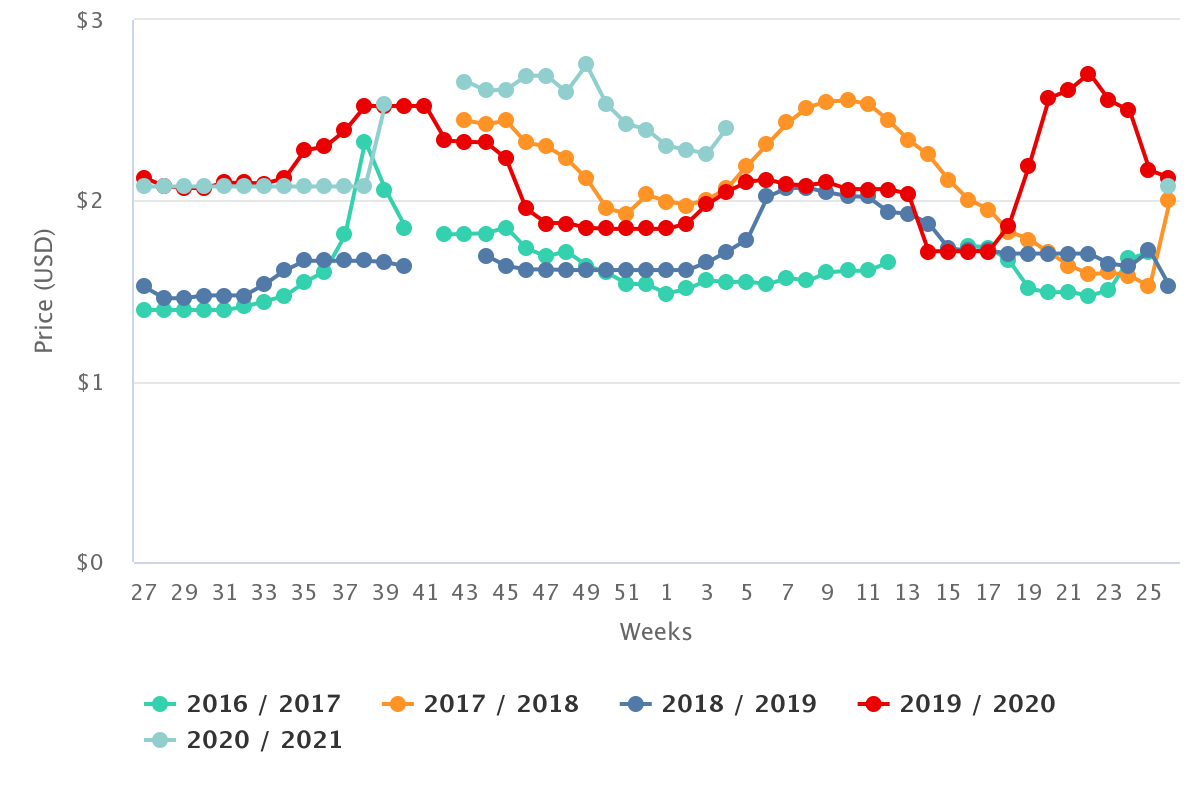
(Source: USDA Market News via Agronometrics) [Agronometrics users can view this chart with live updates here]
This season for high kiwifruit prices in the U.S. market seems to be mainly marked by the increase in the prices of kiwifruit from Italy, as can be seen in the graph below.
Price of kiwifruit from Italy in the U.S. market (USD/kg)
 (Source: USDA Market News via Agronometrics) [Agronometrics users can view this chart with live updates here]
In relation to volumes, what is interesting is that they have been similar to the previous seasons without significant variations, as is shown in the graph below.
Volume of kiwifruit in the U.S. market (kg)
 (Source: USDA Market News via Agronometrics) [Agronometrics users can view this chart with live updates here]
In the midst of another wave of Covid-19, among the possible causes of the high prices this season, seems to be the increase in consumption of vitamin C-rich fruit.
This is also occurring while the volume of lemons in the North American market has decreased compared to previous seasons.
In our ‘In Charts’ series, we work to tell some of the stories that are moving the industry. Feel free to take a look at the other articles by clicking here.
You can keep track of the markets daily through Agronometrics, a data visualization tool built to help the industry make sense of the huge amounts of data that professionals need to access to make informed decisions. If you found the information and the charts from this article useful, feel free to visit us at www.agronometrics.com where you can easily access these same graphs, or explore the other 20 fruits we currently track.


Subscribe to our newsletter