Apples in Charts: Is Honeycrisp's reign over?


In this installment of the ‘In Charts' series, Cristian Crespo of Agronometrics illustrates how the U.S. market is evolving. Each week the series looks at a different horticultural commodity, focusing on a specific origin or topic visualizing the market factors that are driving change.


In a recent 'In Charts' we called the Honeycrisp variety the "queen of the US". This was because, historically, it has had the highest prices per kilogram out of all apple varieties in the market. The variety has significantly set itself out from the rest.
Apples prices in the U.S. by variety (USD/kg)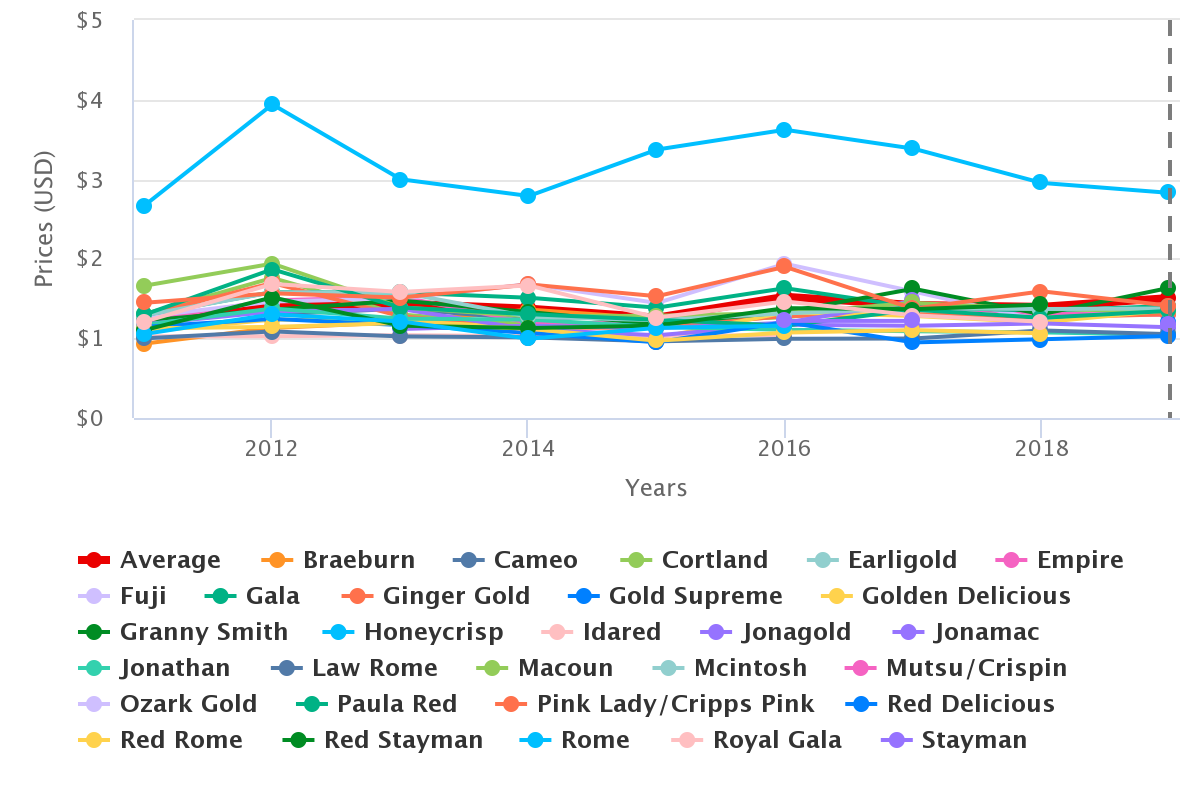
(Source: USDA Market News via Agronometrics. View this chart with live updates here)
But this article shows how the scene is changing and prices have plummeted for the Honeycrisp in the past few months.
Prices have hit an all-time low, the lowest they've seen in 9 years. While it still has some of the best prices relative to other varieties, the difference isn't as big as it was before.
Honeycrisp prices in the U.S. by month (UDS/kg)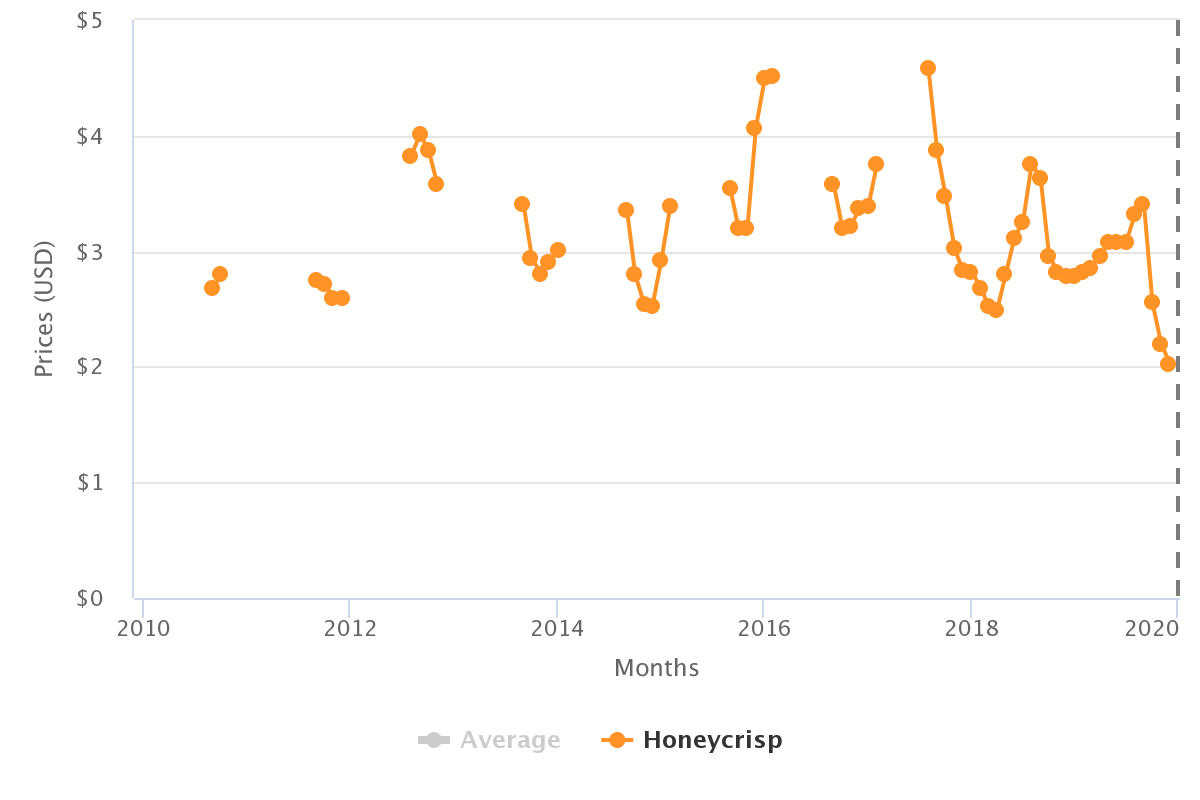
(Source: USDA Market News via Agronometrics. View this chart with live updates here)
The fall in prices is more notable in the following graph, which shows the progression of prices throughout recent weeks as compared to the last four seasons. Here, we are able to see the abrupt fall in Honeycrisp prices in the market relative to previous seasons.
Honeycrisp prices in the U.S. (USD/kg)
(Source: USDA Market News via Agronometrics. View this chart with live updates here)
In the upcoming weeks, we should be attentive to how prices behave. The introduction of new varieties like Cosmic Crisp could have had an effect on Honeycrisp and made the market more competitive. This would make it difficult for Honeycrisp prices to bounce back.
This begs the question - is this the end of the reign of the Honeycrisp in the U.S.?
In our ‘In Charts’ series, we work to tell some of the stories that are moving the industry. Feel free to take a look at the other articles by clicking here.
You can keep track of the markets daily through Agronometrics, a data visualization tool built to help the industry make sense of the huge amounts of data that professionals need to access to make informed decisions. If you found the information and the charts from this article useful, feel free to visit us at www.agronometrics.com where you can easily access these same graphs, or explore the other 20 fruits we currently track.


Subscribe to our newsletter