Agronometrics in Charts: Avocado glut in the US market expected to last at least until mid 2023


In this installment of the ‘Agronometrics In Charts’ series, Sarah Ilyas studies the progress of the Mexican avocado season. Each week the series looks at a different horticultural commodity, focusing on a specific origin or topic visualizing the market factors that are driving change.


The US avocado market is dominated by Hass avocados from Mexico, which accounts for 92% of supply. A much smaller percentage of avocados come from Peru and from farms in California and Florida. “Most of the time, avocado crops alternate the yield year to year. So a big crop one year is followed by a smaller crop the next,” says David Magana, senior fresh produce analyst at Rabo AgriFinancea.
Occasionally, as is the case this year, farmers have back-to-back high-yield seasons. “Much of the avocado oversupply has wound up in the US,” Magana adds, referring to the current season. 74 packing houses and over 30,000 avocado producers are currently engaged in cross-border trading in Mexico.
“Jalisco is a new growing region and adds in volume to the U.S,” says Peter Shore, Vice President of product management for Calavo, adding that this change will make a big difference in Mexican avocados in the future. Many perceive the agreement's integration of 695 orchards, 9,441 hectares, 11 packing houses, and 10 municipalities in Jalisco as advantageous for the sector as a whole.
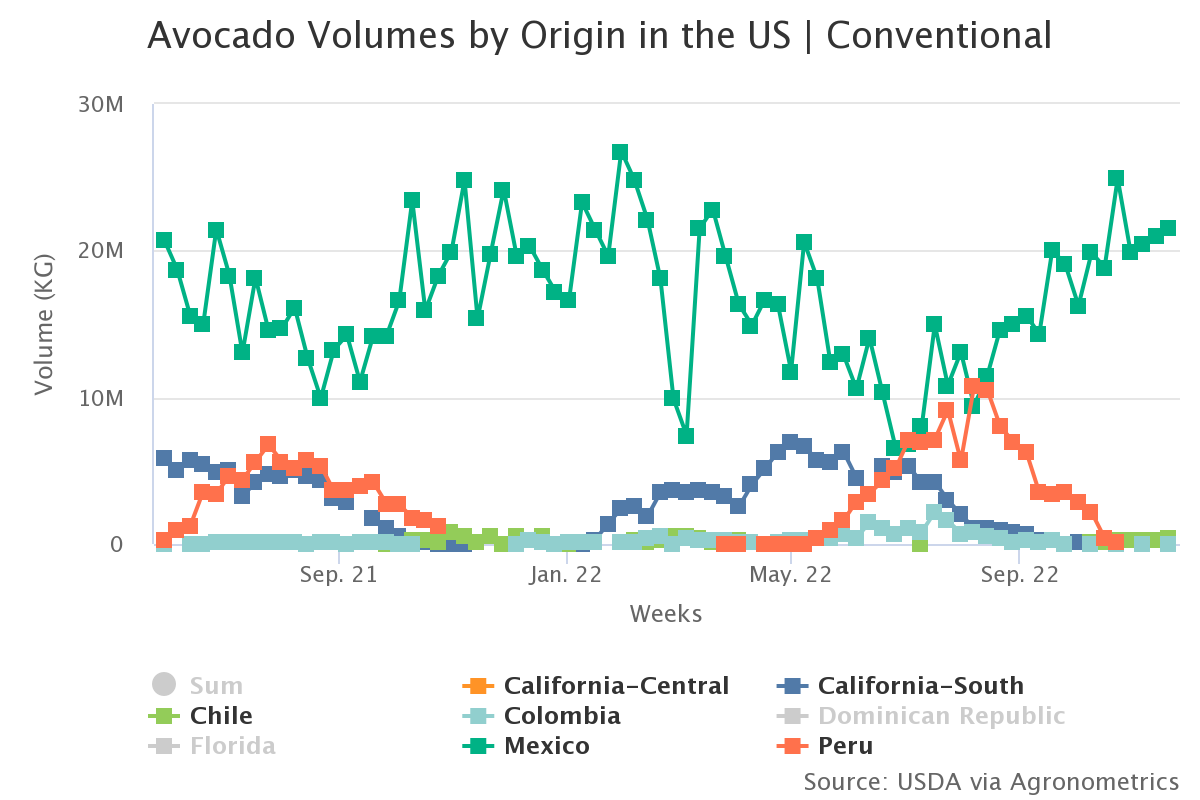 Source: USDA Market News via Agronometrics. (Agronometrics users can view this chart with live updates here)
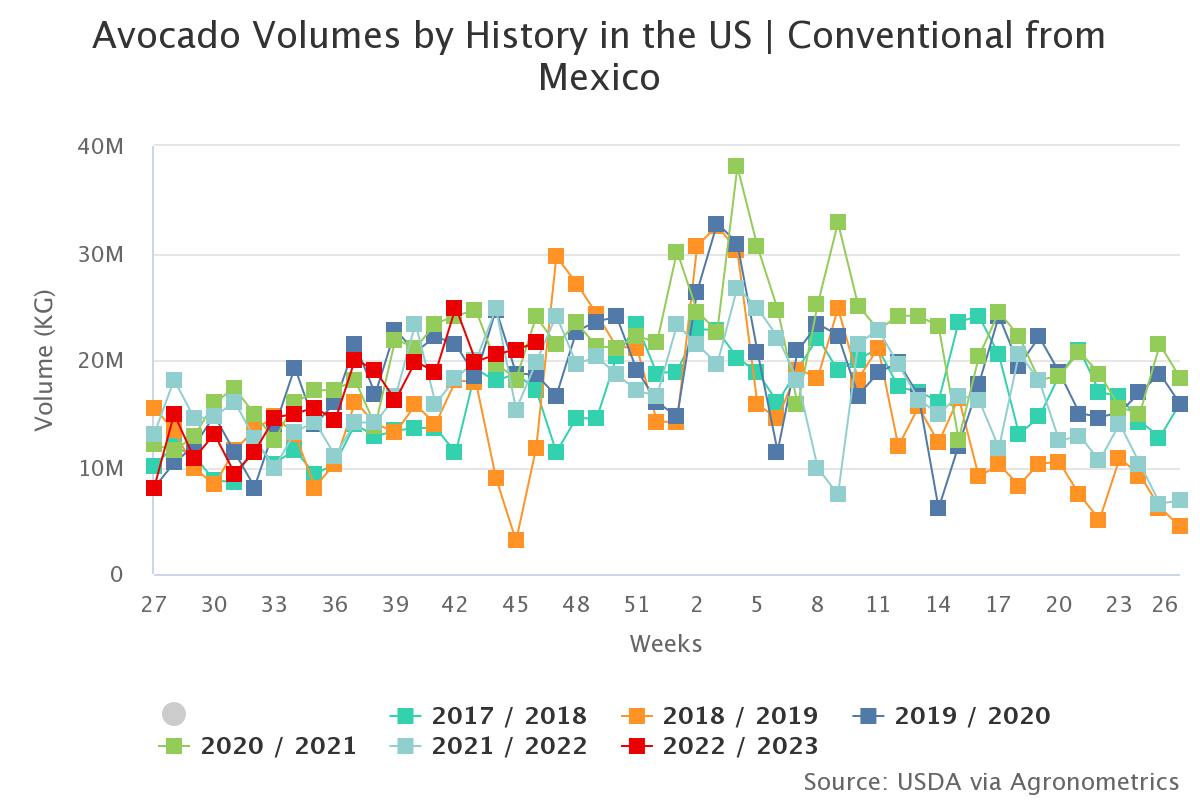
 Source: USDA Market News via Agronometrics. (Agronometrics users can view this chart with live updates here)
The microclimate, volcanic soil, and regular rainfall in Michoacán, according to Alvaro Luque, president and chief executive officer of Avocados From Mexico, "enable avocado trees to bloom year-round, making it the only region shipping Hass avocados to the U.S. 365 days a year." Production of avocados has increased significantly, and the annual supply now exceeds 2 billion pounds.
He goes on to emphasize that imports of Mexican avocados have significantly increased during the past few years. “In just seven years, we have doubled the volume of Mexican avocado imports from 1.2 billion pounds in 2014 to 2.4 billion pounds in 2021”, he adds.
This increase has been fueled by dramatic growth in U.S. demand for avocados and equally dramatic growth in the U.S. import economy. Furthermore, according to Luque, the demand has been primarily fueled by a shift in consumer preferences toward more ethnic and health-promoting foods in diets, an increase in restaurants' use of avocados, a greater understanding of the nutritional advantages of avocados, and marketing campaigns like Avocados From Mexico.
“As Mexican avocado imports move through the food supply chain, they contribute $6.5 billion in economic output and $4 billion in GDP to the U.S. economy”, says Shore.
With the overall cost of grocery items up a startling 13% compared to last year, avocado prices are actually plummeting. This season, avocados from Mexico are in plentiful supply. In fact, there is an oversupply, which has resulted in substantially reduced prices. “Demand for avocados is certainly not decreasing, the Super Bowl is the biggest consumption event for avocados, but we’re certainly seeing many more eating occasions for it.” says Richard Kottmeyer, managing director of food, agriculture and beverage at FTI Consulting.
 Source: USDA Market News via Agronometrics. (Agronometrics users can view this chart with live updates here)
In our ‘In Charts’ series, we work to tell some of the stories that are moving the industry. Feel free to take a look at the other articles by clicking here.
All pricing for domestic US produce represents the spot market at Shipping Point (i.e. packing house/climate controlled warehouse, etc.). For imported fruit, the pricing data represents the spot market at Port of Entry.
You can keep track of the markets daily through Agronometrics, a data visualization tool built to help the industry make sense of the huge amounts of data that professionals need to access to make informed decisions. If you found the information and the charts from this article useful, feel free to visit us at www.agronometrics.com where you can easily access these same graphs, or explore the other 21 commodities we currently track.


Subscribe to our newsletter