


Agronometrics in Charts: Global Trade Data reveals soaring 2025 import volumes post-shutdown


Each week, the series ‘Agronometrics In Charts’ looks at a different horticultural commodity, focusing on a specific origin or topic, and visualizing trade market factors that are driving change. Check out our entire archive.


Written by Sarah Ilyas, from Agronometrics.
United States federal government operations were disrupted following a funding lapse that began on October 1, resulting in a temporary shutdown of several federal agencies. During this period, data publication and reporting schedules were affected, leading to gaps and delays in US trade data availability, Global Trade Data (GTD) reports.

With government operations now resumed, US trade data has been restored, allowing users to once again monitor import flows with full visibility.
Trade is up in the US
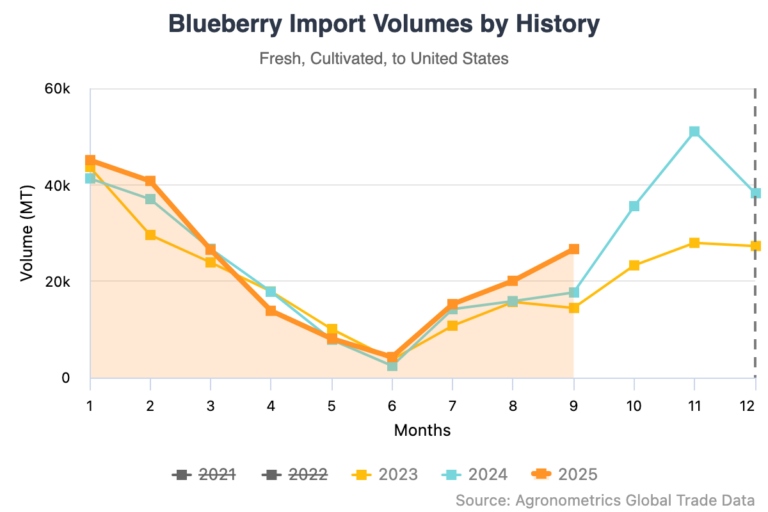
Viewed against the past three years, 2025 trade volumes stand out as notably higher, particularly in the second half of the year.
Monthly flows into the second half exceed levels seen at the same point in 2024 and 2023, reinforcing the view that underlying demand has continued to build despite reporting disruptions caused by the shutdown. As government operations resumed, the reappearance of elevated volumes aligned with this upward trend.
Source: USDA Market News via Agronometrics.
(Agronometrics users can view this chart with live updates here)
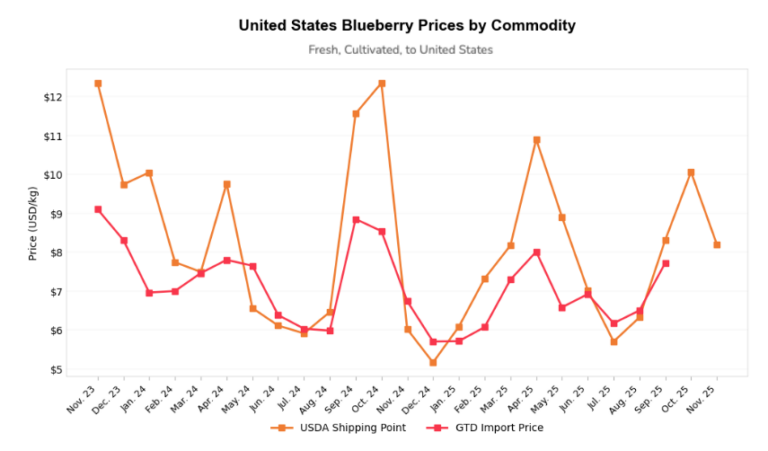
Looking back over the two years of pricing history, the key point is understanding the difference between program pricing and spot pricing.
Import prices are generally closer to program business, while shipping point prices from the US Department of Agriculture (USDA) reflect spot transactions. Programs are the priority, so if an importer falls short on their committed volumes, they need to turn to the spot market to top up.
This increases demand in the spot space and artificially pushes USDA prices higher, as shown in this chart.
Source: USDA Market News via Agronometrics.
(Agronometrics users can view this chart with live updates here)
Both price series follow the same overall trend, but the gap between them is highly meaningful.
When import prices exceed those of the USDA, it typically indicates that sufficient fruit was available and possibly even some overproduction. When USDA prices move higher than imports, it usually signals that importers are short relative to expectations and need extra fruit.
In practical terms, the returns producers can expect will be closer to import pricing, since only a smaller proportion of total fruit moves through the spot market.
Related stories
Stocked by the world—how foreign imports power the US fresh fruit market
As Japan’s production declines, US cherry imports come to the rescue
Shifting vines: How China’s appetite is reshaping the grape market
Chilean table grape forecast: Varietal renewal drives exports despite slight market decline


Subscribe to our newsletter