


Agronometrics in Charts


Agronometrics in Charts: The Evolution of US - Canada agricultural trade: CUSTA, NAFTA, and USMCA
Although the 2026 review introduced some uncertainty, USMCA continues to serve as the foundation for one of the world's largest agricultural trading relationships.
July 16 , 2026

Agronometrics in Charts: Weather whiplash reshapes the 2026 California strawberry season
Warm temperatures in February and March brought the harvest nearly three weeks earlier than usual, before cooler temperatures and rain in April and May slowed production and damaged crops.
July 14 , 2026

Agronometrics in Charts: Mexican mango volumes to drop 27 percent this summer
Cooler-than-normal spring temperatures and reduced flowering in key growing regions are creating production gaps, keeping availability limited through mid-July.
July 09 , 2026

Agronometrics in Charts: USMCA enters a decade of annual reviews, and fresh produce has plenty riding on it
While duty-free access and tariff structures remain unchanged for now, the transition from long-term commitments to yearly negotiations impacts how the produce industry plans its cross-border logistics.
July 07 , 2026

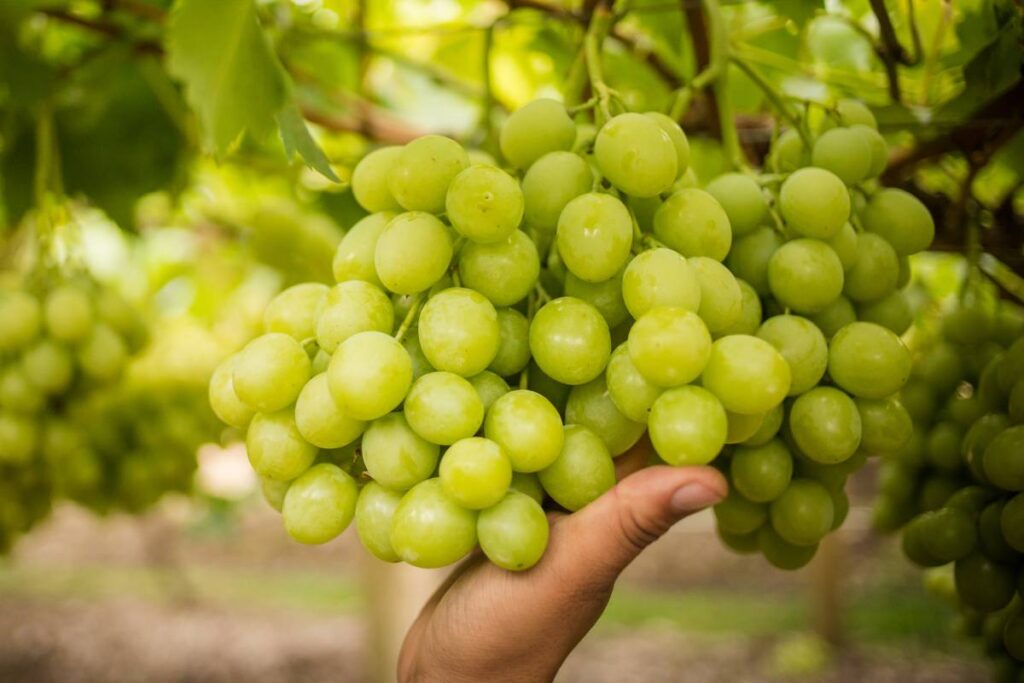
Agronometrics in Charts: How China’s massive table grape output is rewriting global trade flows
Seven consecutive years of production growth are reshaping Southeast Asian trade, challenging Southern Hemisphere origins as the import window narrows.
July 02 , 2026
Agronometrics in Charts: 2026 retail food prices hold steady as farm-level returns weaken
New data highlights a growing disconnect between the produce aisle and the field, where early-year price drops continue to impact annual grower outlooks.
June 30 , 2026

Agronometrics in Charts: The impact of Coachella Valley's early harvest on the US table grape transition
The region's accelerated cycle is concluding early, prompting an immediate handoff to the San Joaquin Valley.
June 25 , 2026

Agronometrics in Charts: USMCA scrutiny puts North American produce trade in the spotlight
Agricultural organizations on both sides of the border are pushing for an extension of the agreement and continued duty-free trade for agricultural products.
June 23 , 2026

Agronometrics in Charts: Colombian avocados continue to gain momentum in the US market
Consumers favor Colombian avocados because they closely resemble Mexican avocados in oil content and creaminess.
June 18 , 2026
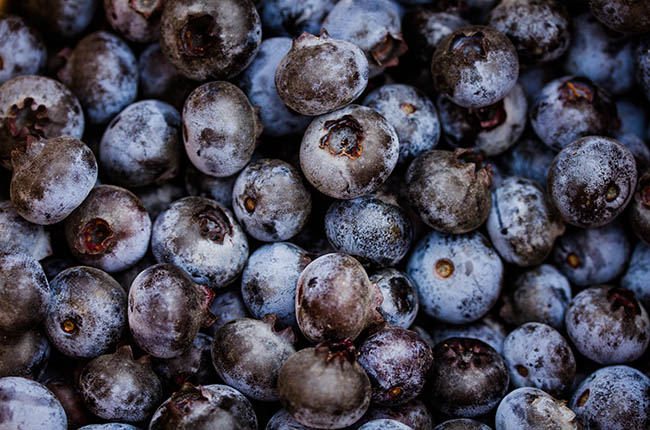
Agronometrics in Charts: Peru's blueberry industry faces climate uncertainty as El Niño risk builds
Growers remain cautious as warming trends threaten to disrupt critical flowering and development stages.
June 16 , 2026