


Agronometrics in Charts: Influx of Chilean cherries expected in U.S. this season


In this installment of the ‘Agronometrics In Charts’ series, Sarah Ilyas evaluates the advent of the Chilean Cherry season and analyzes its implications for the U.S. market. Each week the series looks at a different horticultural commodity, focusing on a specific origin or topic visualizing the market factors that are driving change.


According to the Chilean Cherry Committee’s forecast for this season, cherry exports from Chile are expected to ramp up 9.8% compared to the previous season and around 13,000 metric tons will be shipped to the U.S. market.
This, in part, can be attributed to the fact that Chile did not experience inclement weather conditions such as rain or frost leading up to the end of November.
Chile is also expanding exports and implementing more promotional campaigns aimed for the U.S. market.
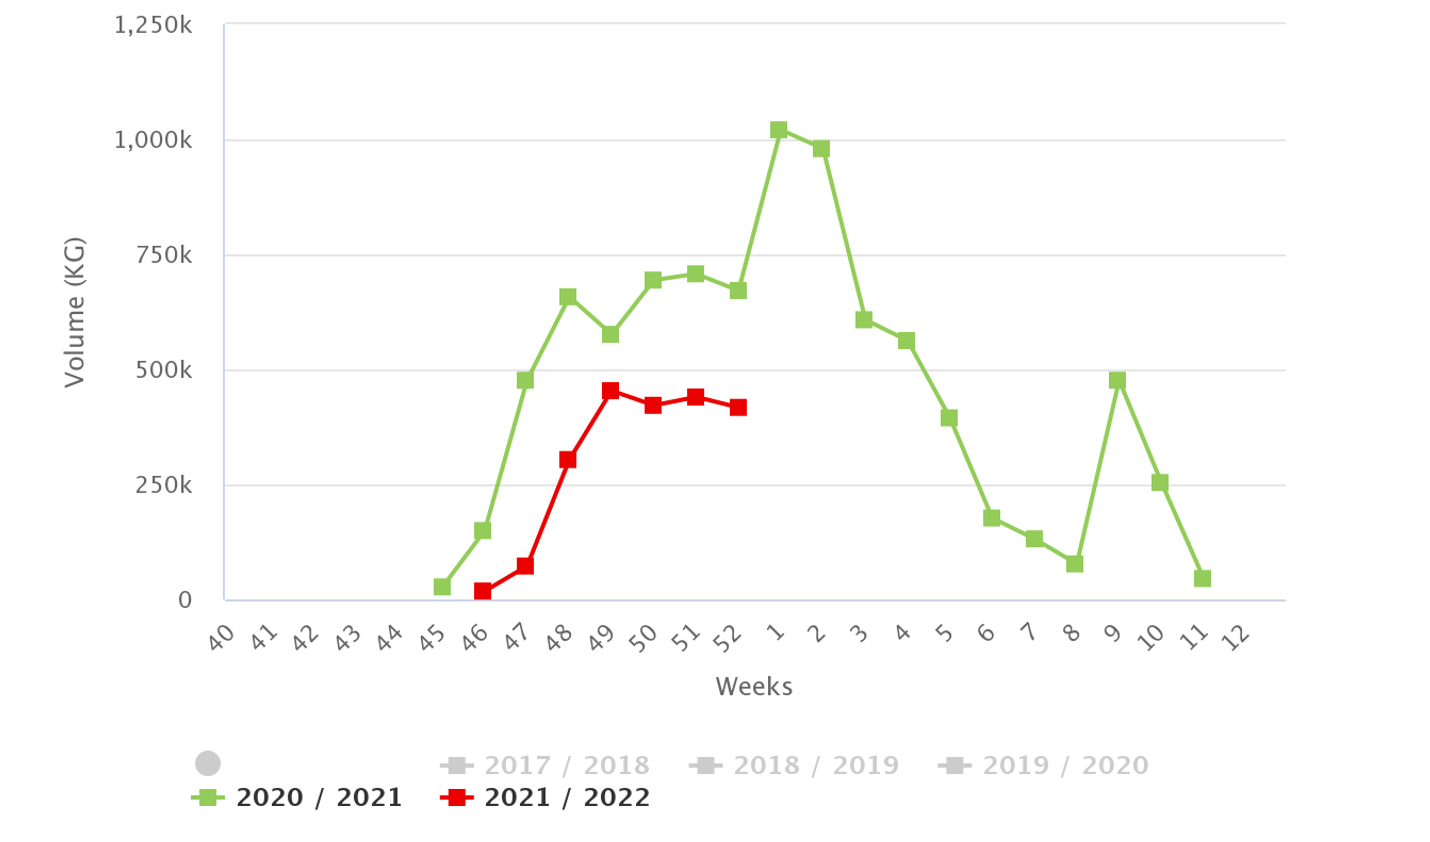
Historic Volumes of Chilean Cherries in the U.S. Market
Source: USDA Market News via Agronometrics. (Agronometrics users can view this chart with live updates here)
The graph below displays the volumes of cherries received since the beginning of this season; the highest quantities were recorded at 453.6 kg in week 49.
Chilean Cherry Volumes in the U.S. Market

Source: USDA Market News via Agronometrics. (Agronometrics users can view this chart with live updates here)
Complying with the trend of the import volume for Chilean cherries this season, the prices until Week 49 were comparatively higher than those recorded during the last season.
As can be observed in the graph below, the cost per kilo was $53 in week 48 compared to $48.38 for the last season’s forty-eighth week.
Week 50 saw a reduction in prices compared to the last season, with costs at $46 per kg. Weeks 51 and 52 also showed a dip in prices when compared to the last season.
Further reduction in prices could be expected in the following weeks as the incoming cumulative volume of cherries continues to soar.
Historic Prices of Chilean Cherries (USD/KG)

Source: USDA Market News via Agronometrics. (Agronometrics users can view this chart with live updates here)
As depicted in the graph below, Chile has been at the forefront when it comes to cherry exports to the U.S.
If we evaluate imports from the past six years, the highest volumes of cherries from Chile in the last six years were recorded in 2018, with quantities peaking at around 8.62M kg.
Cherry Volumes by Origin in the U.S. Market

Source: USDA Market News via Agronometrics. (Agronometrics users can view this chart with live updates here)
The graph below shows the typical freight pattern for cherries exported by Chile. The season typically begins with a spike in air freight usage by Chile for exports to the U.S.
At the beginning of the season, freight by ship is minimal. Air continues to be the main means of transport for Chilean cherries until early to mid-December. Sea freight subsequently becomes more rampant for the export of Chilean cherries.
As can be observed from the graph below, air freight peaked at the end of November in the last season with volumes of around 657,720 kg being exported while the highest quantities exported by boat were around 880,000 kgs in mid-January.
This season, however, showed a plunge of around 31 percent in the peak quantities exported by air in comparison to the last season.
With prices continually dropping it seems like it would be a good moment for more economic shipments by boat to take over.
Shipments by these means, however, have been running 3 to 4 weeks behind last year.
Cherry Volumes by means of transport from Chile in the U.S Market
![]()
Source: USDA Market News via Agronometrics. (Agronometrics users can view this chart with live updates here)
The Chilean Cherry season has been projected to run for longer than 12 weeks for the first time.
While we still need to wait and see how this season pans out, larger marketing campaigns, better weather conditions and a reduction in exports to China are clear indicators that the U.S. could expect larger supplies of Chilean cherries this season, which might yet surpass the volume of exports from last year.
In our ‘In Charts’ series, we work to tell some of the stories that are moving the industry. Feel free to take a look at the other articles by clicking here.
All pricing is for domestic U.S. produce, representing the spot market at Shipping Point (i.e. packing house/climate controlled warehouse, etc.). For imported fruit, the pricing data represents the spot market at Port of Entry.
You can keep track of the markets daily through Agronometrics, a data visualization tool built to help the industry make sense of the huge amounts of data that professionals need to access to make informed decisions. If you found the information and the charts from this article useful, feel free to visit us at www.agronometrics.com where you can easily access these same graphs, or explore the other 20 fruits we currently track.


Subscribe to our newsletter


