


Agronometrics in Charts: Pacific Northwest’s apples bear the brunt


In this installment of the ‘Agronometrics In Charts’ series, Sarah Ilyas evaluates the state of the apple industry within the U.S. Each week the series looks at a different horticultural commodity, focusing on a specific origin or topic visualizing the market factors that are driving change.


Apples are grown commercially in 35 states across the United States. With more than 7,500 known varieties, the diversity of colors, tastes and aromas is infinitely rich.
The Pacific Northwest recently braved an especially inclement winter that took a toll on apple production.
According to U.S. Apple’s recently published report, the total number of apples in storage on February 1, 2022, was 111.1 million bushels, 1.4 percent less than last February’s total of 112.7 million bushels and 5.1 percent below the five-year average for that date.
A relentless winter coupled with supply chain constraints and dire labor shortages significantly reduced apple volumes.
“Each year we gear up for the inevitable, unexpected situations in a growing season be it weather, material pricing, or even changes in personnel, but last year combined all of these and more,” Brett Baker of United Apple said.
As made evident from the graph below, volumes in the sixth week stood at around 57,000 metric tons (MT), a 4 percent decline compared to the volume of 60,000MT recorded in the sixth week of 2021.
While quantities from the Pacific Northwest are dwindling, Eastern regions are faring slightly better.

Source: USDA Market News via Agronometrics. (Agronometrics users can view this chart with live updates here)
In the past five years, Michigan has been doubling down on new apple plantations, with a leaning towards Honeycrisp, Evercrisp, Fujis and Galas.
Additionally, Michigan, despite several nights of frost, has had a favorable growing season.
“After the weather events of early spring, we experienced a good growing season right up until harvest time,” Scott Swindeman of Applewood Fresh Growers LLC in Sparta, MI said.
Volumes for next season are projected to be at 30 million bushels which will equate to two or three times the volume for the fresh market than what Michigan has witnessed in the last two years.

Source: USDA Market News via Agronometrics. (Agronometrics users can view this chart with live updates here)
Volumes from Washington, in contrast, incurred higher freight costs and were tighter compared to the previous season, particularly between weeks 3 and 6, as shown below.
Washington’s apple crop comprises 70% to 80% of the U.S. fresh apple supply and therefore any disruptions in the supply chain or production can significantly impact the country-wide supply.
The last year saw record-setting hot temperatures, bringing Gala production down by about 12% compared to the year before while Honeycrisp volumes shrunk by about 3%.

Source: USDA Market News via Agronometrics. (Agronometrics users can view this chart with live updates here)
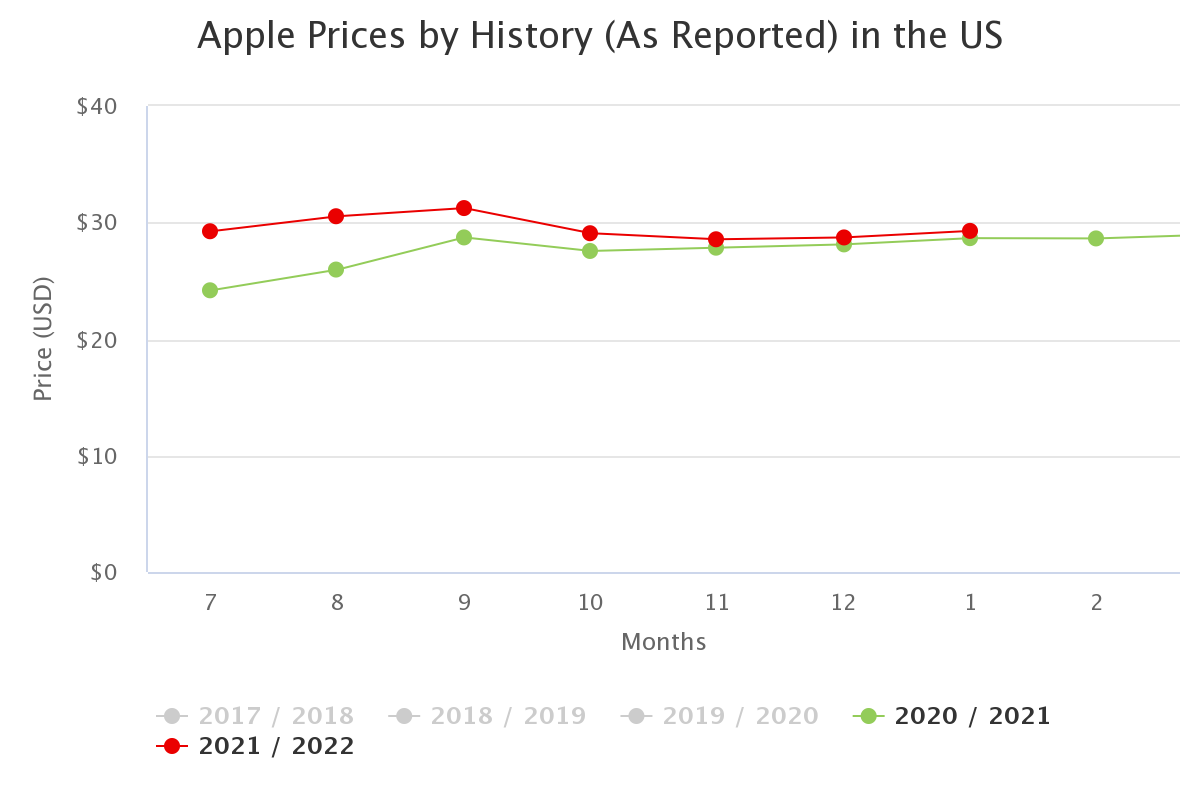
Prices at the end of January were recorded at US$29.28 per package, a 2 percent increase compared to the last season.
“They’re gradually ticking upwards which our growers need so it’s tracking in the right direction,” Dan Davis of Starr Ranch Growers based in Wenatchee, WA was reported as saying.
The demand for apples has gained traction among consumers all over the globe especially due to elevating concerns for wellness; organic apples, in particular, garner price premiums.
Organic apple imports from regions such as Chile, Argentina and New Zealand could be initiated as early as April.
The general course of this season will be determined by a multitude of factors, ranging from the availability of trucks to weather viability.
Source: USDA Market News via Agronometrics. (Agronometrics users can view this chart with live updates here)
In our ‘In Charts’ series, we work to tell some of the stories that are moving the industry. Feel free to take a look at the other articles by clicking here.
All pricing for domestic U.S. produce represents the spot market at Shipping Point (i.e. packing house/climate controlled warehouse, etc.). For imported fruit, the pricing data represents the spot market at Port of Entry.
You can keep track of the markets daily through Agronometrics, a data visualization tool built to help the industry make sense of the huge amounts of data that professionals need to access to make informed decisions. If you found the information and the charts from this article useful, feel free to visit us at www.agronometrics.com where you can easily access these same graphs, or explore the other 21 commodities we currently track.


Subscribe to our newsletter


