


Agronometrics in Charts: California avocado season well underway


In this installment of the ‘Agronometrics In Charts’ series, Sarah Ilyas studies the progress of the California avocado season. Each week the series looks at a different horticultural commodity, focusing on a specific origin or topic visualizing the market factors that are driving change.


California meets about 10% of the nation’s annual avocado consumption. According to the California Avocado Commission (CAC), projections for 2022 are at 306-million-pounds, with the Hass variety making up the majority of the harvest.
Most of the California avocado season volume is expected to occur mid-April through mid-July, with the season mellowing out from August to October. With its balmy weather and fertile soil, California offers the perfect breeding ground for avocados.
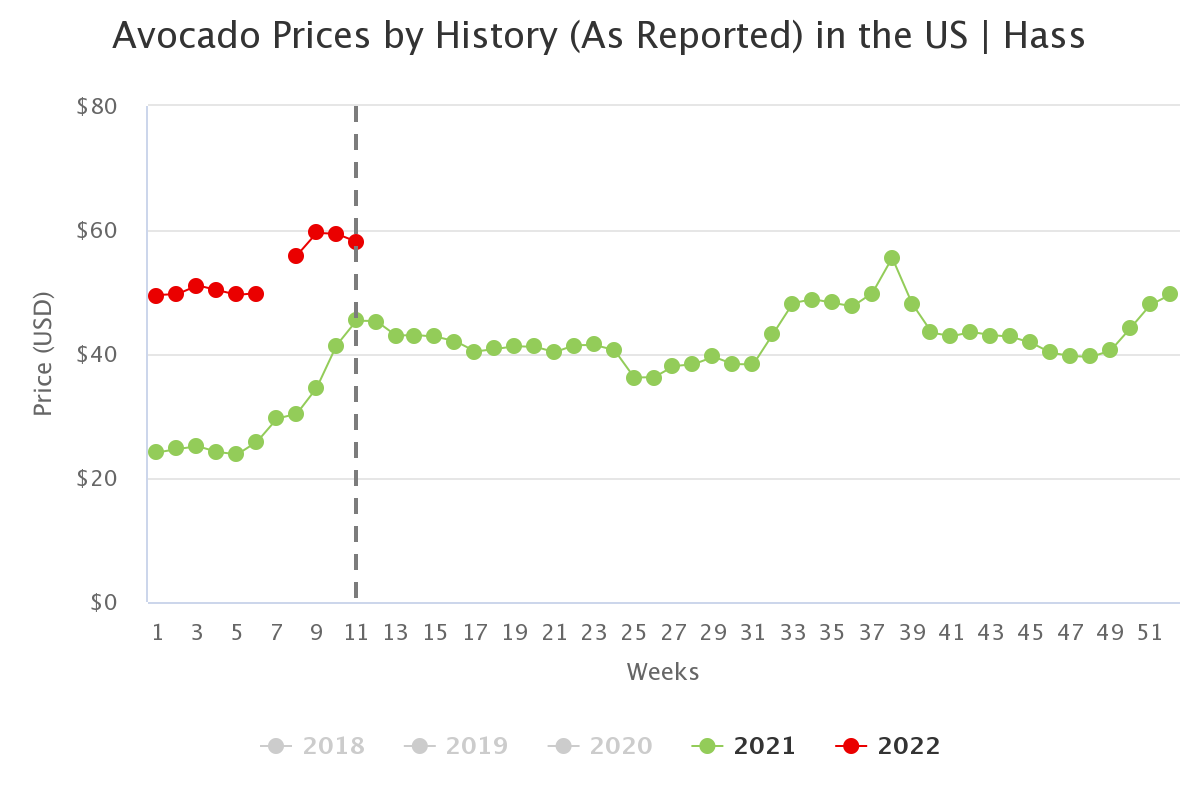
The CAC had projected about 6-8 million pounds in January and February but yields of around 40 million were recorded by March 7. The year kicked off with robust growth due to rains, dry spells, however, have returned and growers are looking forward to more rains to help with avocado sizing. Week 10, this season, saw volumes of around 3.7 K tonnes, around three times the volume recorded in Week 10 of 2021.

(Source: USDA Market News via Agronometrics. Agronometrics users can view this chart with live updates here)
Many trees, especially in the South have been bearing size-70s and 84s rather than the 48s and 60s that retailers have a preference for. The graph below accentuates the effect of size on pricing. Sizing is expected to improve come April.

(Source: USDA Market News via Agronometrics. Agronometrics users can view this chart with live updates here)
Due to a lack of freezes or strong winds this season, the produce has been faring well. “We are hoping for good rainfall totals in March to help the fruit size-up for growers. We want a good distribution of sizing by mid to late April, which is when we typically see the first major uptick in harvest volume of locally-grown avocados in preparation for Cinco de Mayo.” says Doug Meyer, senior vice-president of sales and marketing for West Pak Avocado.”
High price rates have been trending so far in this seaso; prices in week 11 were in the vicinity of $58.13 per package, a 28 percent climb compared to last year. “The last couple of years, we’ve had some wind events that have been pretty serious,” Phil Henry, president of Henry Avocado Corp., Escondido, Calif said in an industry publication. “We’re irrigating, so we think fruit size will be OK,” he says. “It just costs more money.” he adds
(Source: USDA Market News via Agronometrics. Agronometrics users can view this chart with live updates here)
Scant supplies from Mexico enabled California to have an earlier start to the season. Harvest will continue to ramp up through April. Avocados are deemed the ‘green gold’ and command premium prices from retailers. It takes 14 to 18 months to grow a single California Avocado and one California Avocado tree can produce up to 200 avocados (or 100 pounds of fruit) per season.
Going forward, a strong demand is expected for California avocados this season and while April through July are peak volume months, some varieties and regions will have supplies through the end of summer/early fall.
In our ‘In Charts’ series, we work to tell some of the stories that are moving the industry. Feel free to take a look at the other articles by clicking here.
All pricing for domestic US produce represents the spot market at Shipping Point (i.e. packing house/climate controlled warehouse, etc.). For imported fruit, the pricing data represents the spot market at Port of Entry.
You can keep track of the markets daily through Agronometrics, a data visualization tool built to help the industry make sense of the huge amounts of data that professionals need to access to make informed decisions. If you found the information and the charts from this article useful, feel free to visit us at www.agronometrics.com where you can easily access these same graphs, or explore the other 21 commodities we currently track.


Subscribe to our newsletter


