


Agronometrics in Charts: Mexican blueberry industry potential to be deliberated at the 22nd International Blueberry Seminar


In this installment of the ‘Agronometrics In Charts’ series, Sarah Ilyas studies the state of the Mexican blueberry market. Each week the series looks at a different horticultural commodity, focusing on a specific origin or topic visualizing the market factors that are driving change.


The blueberry, first grown for sale in 1916, is a native North American crop that that has risen in popularity among consumers, becoming a coveted commodity in the US market.
Its consumption has increased over the years owing to being deemed a superfood thanks to its nutritional content and the presence of anthocyanins and antioxidants, which impart the berry its characteristic color. Over the course of the past 10 years, the supply of fresh blueberries available for American consumption has increased manifold.
Mexico allocates 95% of its production to the US and Canadian markets. Berries are grown in 22 of the 32 states in Mexico with Michoacán, Jalisco, Guanajuato, Sinaloa and Baja California being the main producing areas.
Mexican production extends from September to June and peaks around February to April. Despite some overlap with the production windows of Chile and Peru, Mexico sustains an edge in the US market owing to its proximity to the country and thus its ability to supply fresher produce.
A growth of eight to 10 percent in Mexican berry shipments is expected in 2022, according to a study by Agroberichten Buitenland. The season peaked around week 15 with volumes at 4.8 K tonnes this year, a 22 percent increase compared to the previous season.
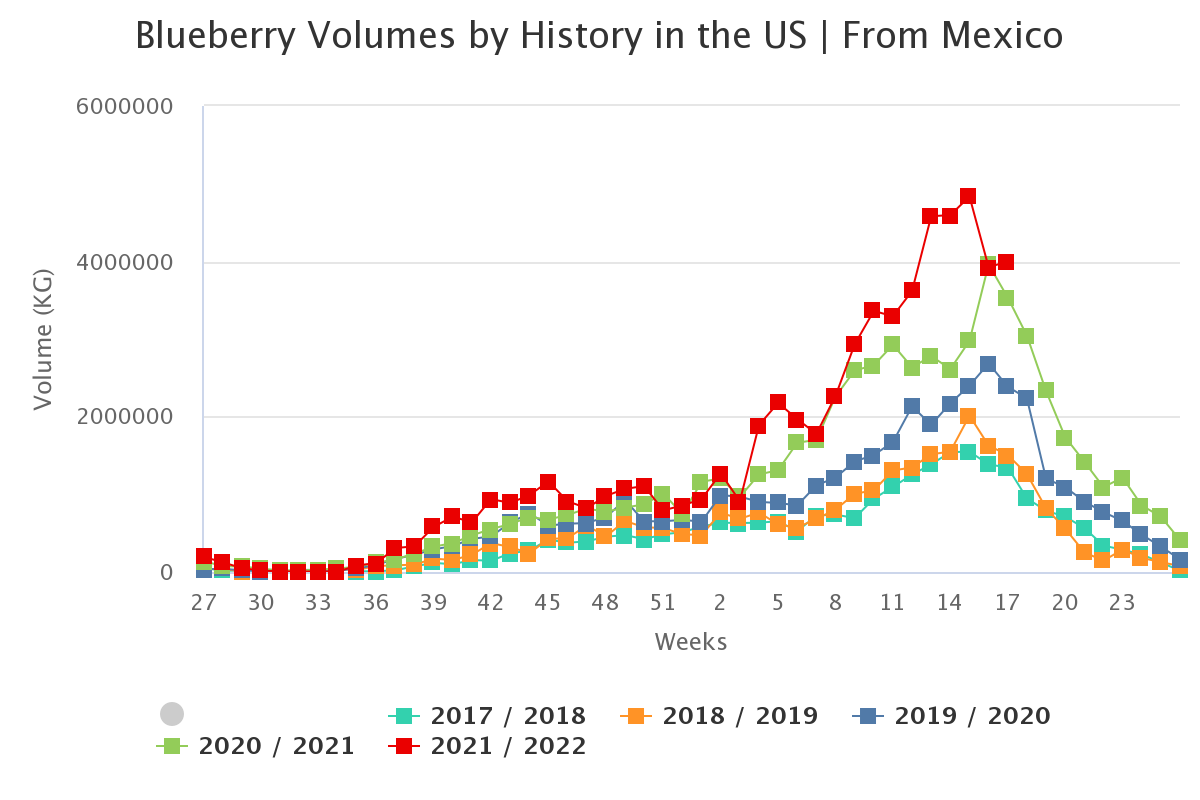
(Source: USDA Market News via Agronometrics. Agronometrics users can view this chart with live updates here)

(Source: USDA Market News via Agronometrics. Agronometrics users can view this chart with live updates here)
The highest prices recorded this season were $24 per package in weeks 3 and 4. The lowest price was recorded in week 9 at $11.4 per package. On average, trending prices have been lower in comparison to the previous season which witnessed prices as high as $32 per package.

(Source: USDA Market News via Agronometrics. Agronometrics users can view this chart with live updates here)
The XXII International Blueberry Seminar that will take place at Expo Guadalajara on May 25 and 26 will be a comprehensive program which will address different facets of the Mexican blueberry industry and will go on to discuss the challenges faced by it. The Mexican blueberry industry holds great potential; this potential can be tapped into by the introduction of new varietal alternatives, diversification of destination markets and by virtue of the enhancement of product quality to contribute to a more sustainable industry.
In our ‘In Charts’ series, we work to tell some of the stories that are moving the industry. Feel free to take a look at the other articles by clicking here.
All pricing for domestic US produce represents the spot market at Shipping Point (i.e. packing house/climate controlled warehouse, etc.). For imported fruit, the pricing data represents the spot market at Port of Entry.
You can keep track of the markets daily through Agronometrics, a data visualization tool built to help the industry make sense of the huge amounts of data that professionals need to access to make informed decisions. If you found the information and the charts from this article useful, feel free to visit us at www.agronometrics.com where you can easily access these same graphs, or explore the other 21 commodities we currently track.


Subscribe to our newsletter


