


Agronometrics in Charts: Mexican mango production projected to increase despite climatic challenges


In this installment of the ‘Agronometrics In Charts’ series, Sarah Ilyas studies the state of the Mexican mango season. Each week the series looks at a different horticultural commodity, focusing on a specific origin or topic visualizing the market factors that are driving change.


According to a recently published report by the National Mango Board ( NMB ), the Mexican mango season will run until the first week of October with a projection of approximately 93 million boxes. Mexico’s main varieties are: Tommy Atkins (40 percent), Ataulfo/Honey (27 percent), Kent (19 percent), Keitt (11 percent) and Others (3 percent).
Volume shipped from Mexico was approximately 3,531,048 boxes for a total of 81,012,182 boxes for the season. During the same week last year, volume shipped from Mexico was 2,496,314 boxes for a total of 73,429,385 boxes.
The 2022 Mexican mango season is projected to be about 11 percent higher YOY.
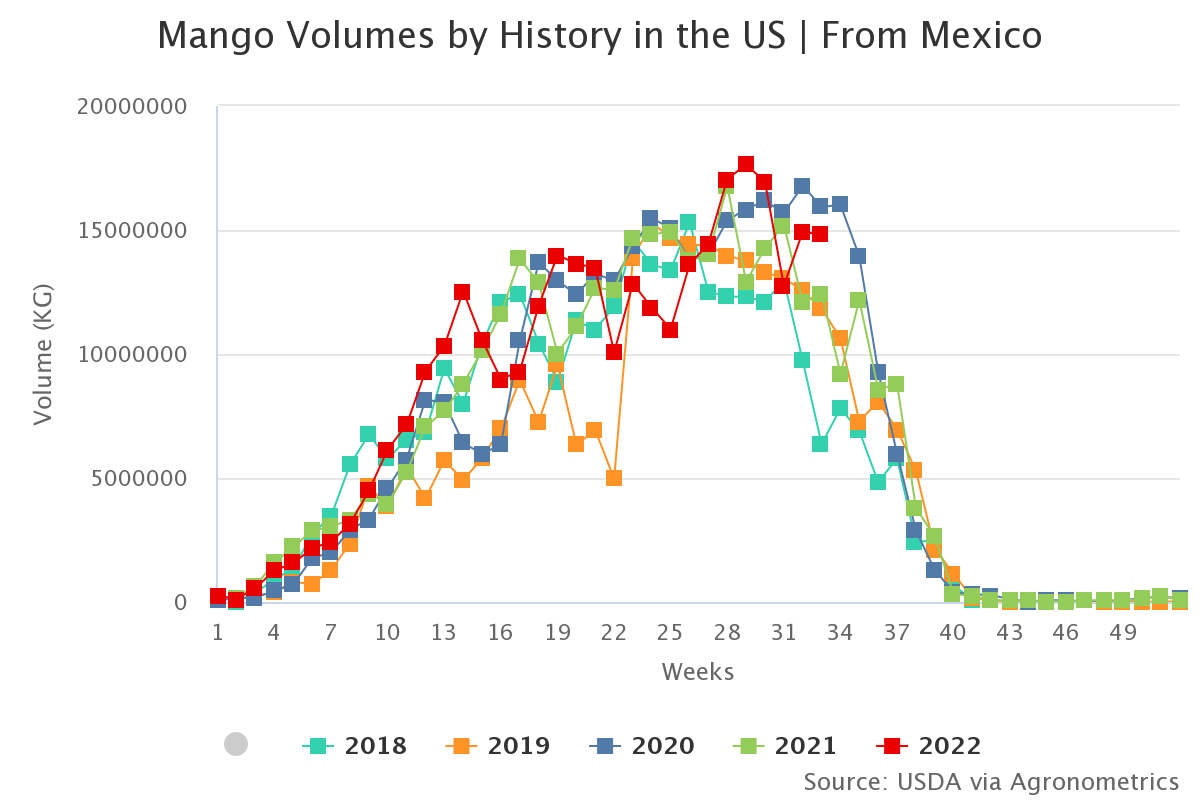
Source: USDA Market News via Agronometrics. (Agronometrics users can view this chart with live updates here)
According to the report, for large Ataulfo/Honey varieties, average volume shipped by count (percent) for size 14 mangoes was 19.2 percent, size 16 contributed 19.3 percent of the volume shipped by count and 17.3 percent of the volume shipped by count consisted of size 18s.
For Tommy Atkins 16.9 percent of shipped volume consisted of size 7s, 21.1 percent was size 9 while 23.4 percent was size 10.
For Kent varieties, size 7 made up 20.4 percent of the average volume shipped by count (percent), 19.2 percent was size 9 while 18.7 percent was size 10.
Prices in week 33 were at $5 per package for 12s and 14s while the lowest recorded price was $2.75 per package for 22s.

Source: USDA Market News via Agronometrics. (Agronometrics users can view this chart with live updates here)
As Mexico nears the end of its mango harvest, capricious weather has begun to astonish producers and exporters, as they witness droughts in the West and South, while torrential rain leads to flash floods in the North.
Increases in costs of cardboard, freight, production inputs, fertilizers, and other inputs has led to an overall increase in production costs.
Mexico, however, continues to be the world's leading mango exporter and the flavor and texture of its mango varieties have led to a significant increase in their consumption in the United States. Annual per capita mango consumption in the U.S. went from 0.85 kg in 2005 to 1.65 kg in 2020, an increase of 93.1 percent.

Source: USDA Market News via Agronometrics. (Agronometrics users can view this chart with live updates here)
In our ‘In Charts’ series, we work to tell some of the stories that are moving the industry. Feel free to take a look at the other articles by clicking here.
All pricing for domestic U.S. produce represents the spot market at Shipping Point (i.e. packing house/climate controlled warehouse, etc.). For imported fruit, the pricing data represents the spot market at Port of Entry.
You can keep track of the markets daily through Agronometrics, a data visualization tool built to help the industry make sense of the huge amounts of data that professionals need to access to make informed decisions.
If you found the information and the charts from this article useful, feel free to visit us at www.agronometrics.com where you can easily access these same graphs, or explore the other 21 commodities we currently track.


Subscribe to our newsletter


