


Agronometrics in Charts: Mexico wraps up record-breaking mango season and Ecuador steps on the gas


Each week, the series ‘Agronometrics In Charts’ looks at a different horticultural commodity, focusing on a specific origin or topic, and visualizing market factors that are driving change. Check out our entire archive.


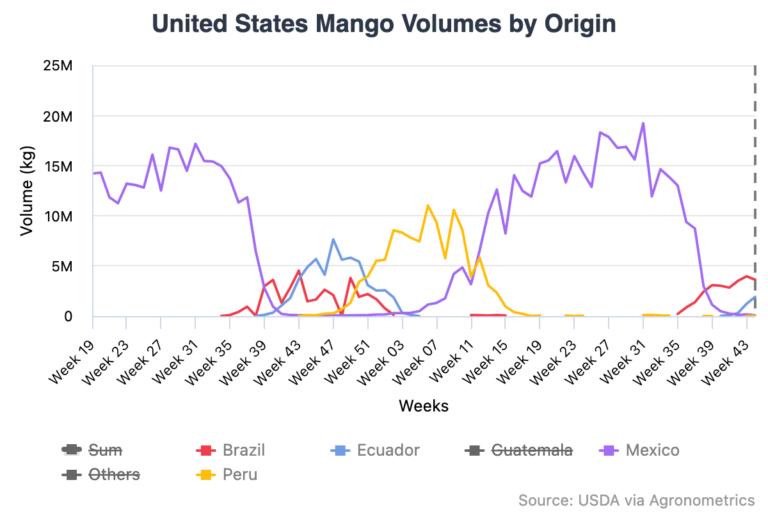
As the US enters peak offshore mango season, global supply lines are shifting. Ecuador is currently at the height of its season, and Peru is building momentum to take the baton through early 2026.
Mango market breakdown
Mexico, the dominant supplier to the US, just closed out a historic season, with exports reaching 95.6 million boxes, the highest volume on record. The North American country continues to supply smaller volumes of irradiated fruit, which now account for ten percent of its total shipments, adding to this year's 10 million boxes, up sharply from 2.75 million in 2021.
Meanwhile, Brazil is nearing the end of its season with four to five weeks left. Despite early concerns about tariffs, consumer demand held steady even as prices rose, allowing Brazil to ship an expected 9.5 million boxes, comparable to last year’s total.
Ecuador is currently operating at full speed, and weekly shipments are expected to reach 1.7 million boxes during the second half of November. Total projected shipments stand at 14 million boxes for the season, slightly below 2024’s volume. Shipments will begin winding down in early December and finish by the end of the year.
Peru, the largest offshore supplier to the US, has started its season gradually, with 168,000 boxes shipped by the end of week 43. Volumes are expected to climb steadily through December, reaching 2.5 million boxes per week by early January. The season will peak through the first month of 2026, with total shipments projected at 23.2 million boxes, down 21 percent from last year’s record.
With a smooth handoff from Ecuador to Peru, US markets are well-positioned for steady mango availability through the winter months.
Source: USDA Market News via Agronometrics.
(Agronometrics users can view this chart with live updates here)
Related stories
USDA referendum to decide future of National Mango Board. Vote concludes November 12.
Mango industry must comply with FDA’s Final Traceability Rule by July 2028


Subscribe to our newsletter


