


Stonefruit in Charts: Prices at the start of the import season


In this installment of the ‘In Charts' series, Cristian Crespo of Agronometrics illustrates how the U.S. market is evolving. Each week the series looks at a different horticultural commodity, focusing on a specific origin or topic visualizing the market factors that are driving change.


A few weeks ago the first volumes of Chilean nectarines and peaches reached the U.S. Here, we will take a look at how prices have been behaving in the market so far. Previously, we have explained how Chilean cherries have been performing in the U.S. market.
Currently, nectarine prices are a bit lower than they were at this time last year. Average nectarine prices for week 3 were US$1.93/kg. During the same period last year, nectarine prices were at US$2.17, showing a 29.5% decrease.
Nectarine Prices in U.S. Market (USD/kg)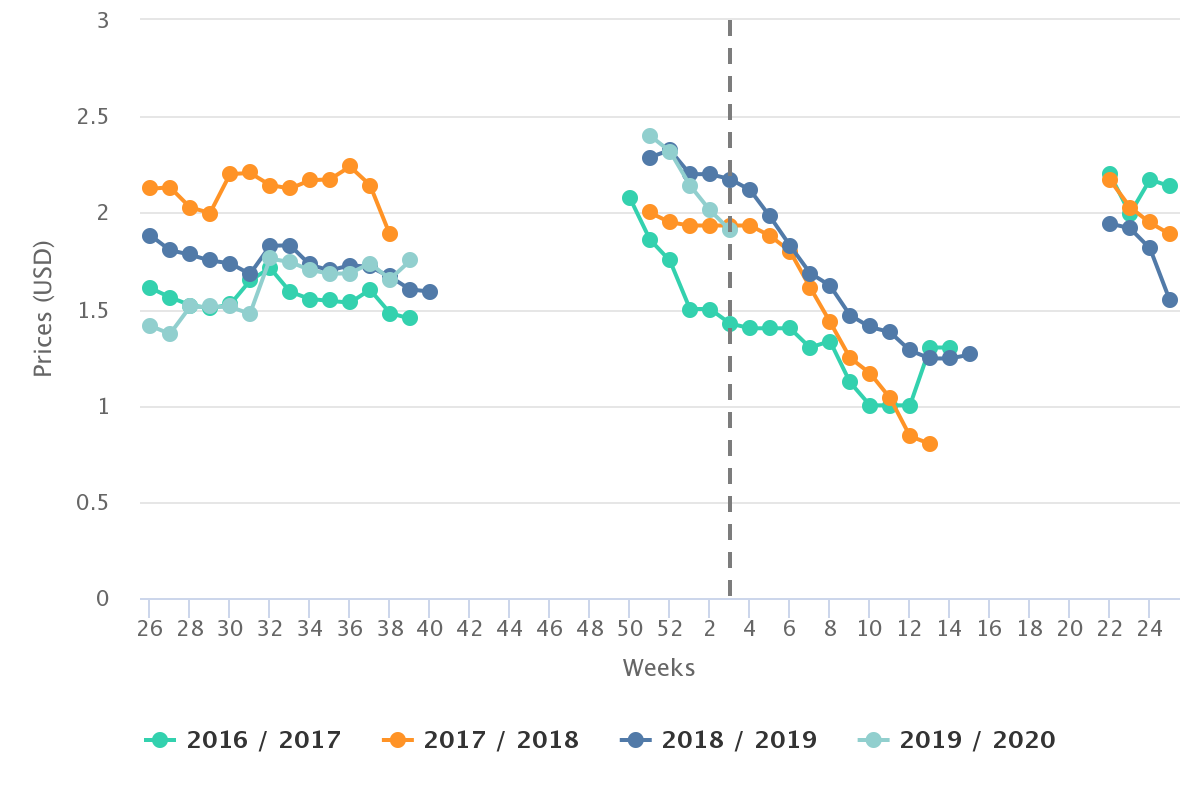
(Source: USDA Market News via Agronometrics. View this chart with live updates here]
Similarly, peach prices have been down as well. As shown in the chart below, while peach prices are lower than last year, the decline isn't as large as with nectarine prices. In the third week, average prices were US$1.74/kg, 10% lower than the same time last year.
Peach Prices in U.S. Market (USD/kg)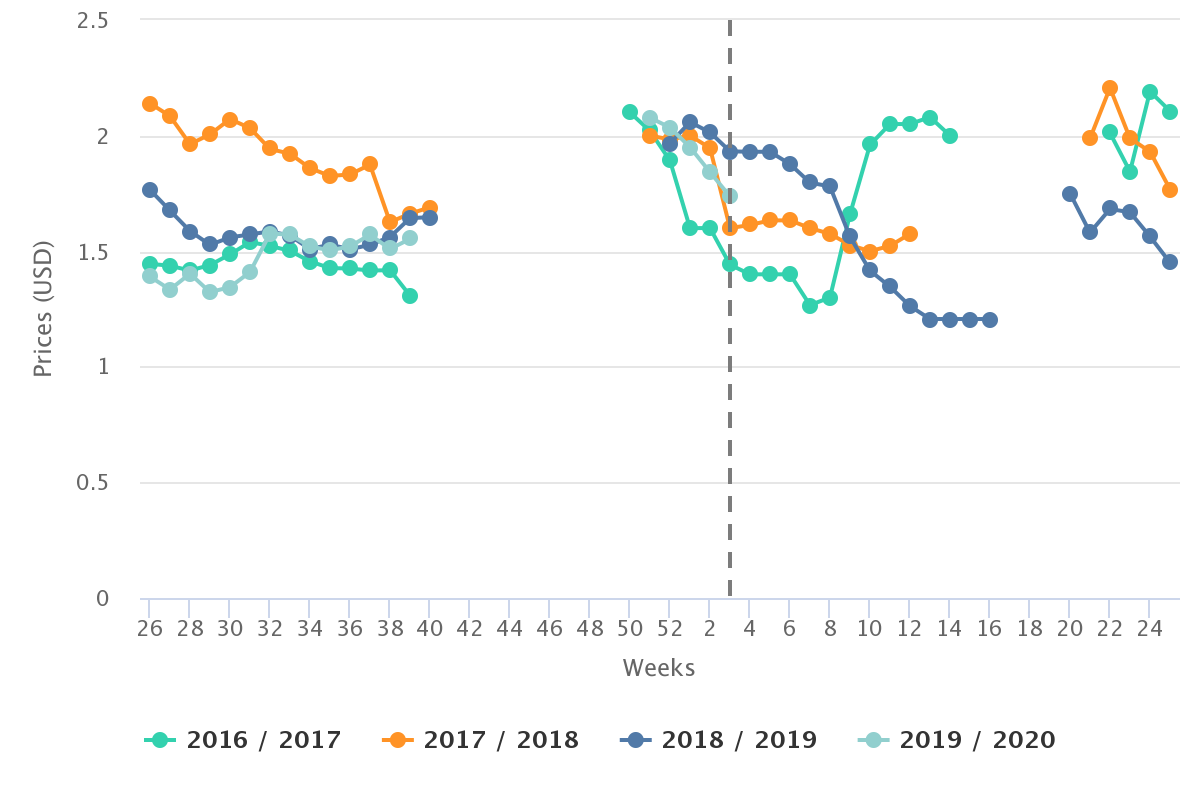
(Source: USDA Market News via Agronometrics. View this chart with live updates here]
In December, exports of stone fruit out of Chile saw a notable rise. The Chilean Exporters' Association said that exports reached 97m metric tons (MT) for 2019/20 - volume consistent with last season.
In other news, although plums began arriving in North America, there is still no information on plum pricing in the market. The upcoming weeks will tell us what the market might look like.
In our ‘In Charts’ series, we work to tell some of the stories that are moving the industry. Feel free to take a look at the other articles by clicking here.
You can keep track of the markets daily through Agronometrics, a data visualization tool built to help the industry make sense of the huge amounts of data that professionals need to access to make informed decisions. If you found the information and the charts from this article useful, feel free to visit us at www.agronometrics.com where you can easily access these same graphs, or explore the other 20 fruits we currently track.


Subscribe to our newsletter


