


Grapes in Charts: Volumes through March running higher than last year


In this installment of the ‘In Charts' series, Cristian Crespo of Agronometrics illustrates how the U.S. market is evolving. Each week the series looks at a different horticultural commodity, focusing on a specific origin or topic visualizing the market factors that are driving change.


For this "In Charts", we will outline how the U.S. grape market has been behaving recently, looking at pricing, volumes, origin markets and differing varieties of table grapes.
As shown in the chart below, table grape prices in North American markets have decreased in the first few months of 2020. Data further down will better explain this shift and what could happen for prices short-term as the season advances.
Historical prices of table grapes (USD/kg) in the U.S. market

(Source: USDA Market News via Agronometrics. View this chart with live updates here).
Meanwhile, grape volumes during the first few months of 2020 are higher than those recorded at the same time last year.
Table grape volumes in the U.S. market
(Source: USDA Market News via Agronometrics. View this chart with live updates here)
South Africa, Peru and Chile all reported higher volumes of exports sent to the U.S. for this period in the beginnings of 2020 in comparison to 2019.
Time will tell in the upcoming weeks when it will be easier to understand the impact of Covid-19 on the North American market, but exports out of Chile have undoubtedly been impacted.
Looking forward, we will also have to monitor what happens with Mexican table grapes as the country anticipates 20% less volume exported and that their fruit will arrive to California earlier than usual - according to all foreseeable indications. This may potentially cause prices to shift in the near future.
The following graph demonstrates the different dates that table grapes have arrived to the U.S. market. This show when some markets begin sending their fruit and others enter the market.
Table grape volumes by origin in the U.S.
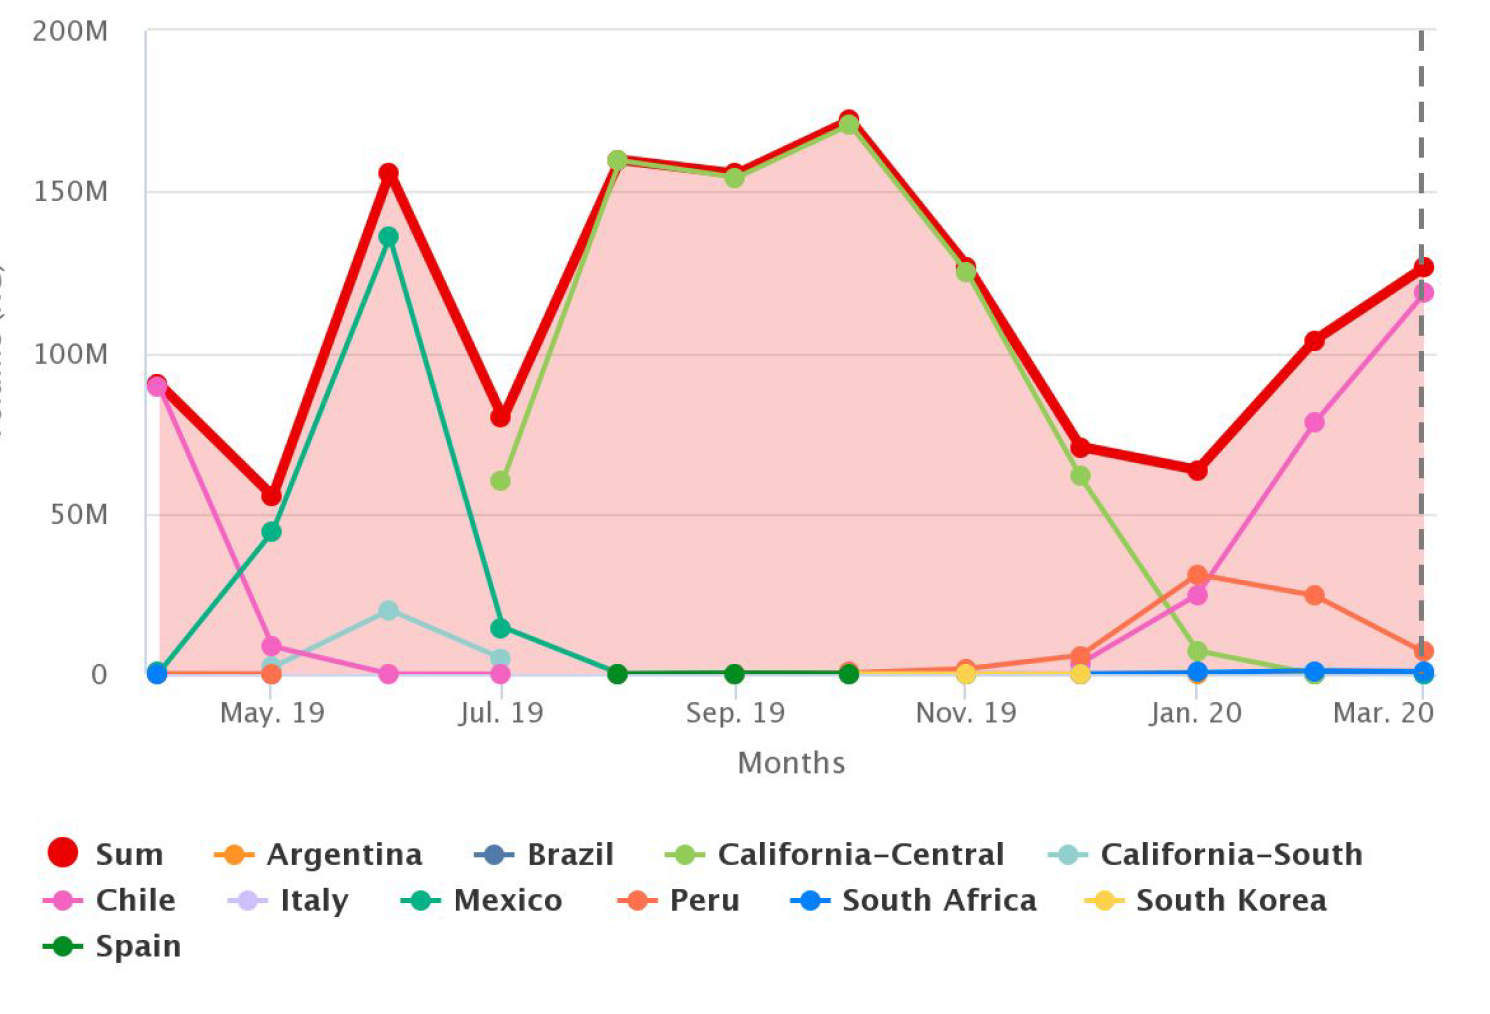
(Source: USDA Market News via Agronometrics. View this chart with live updates here)
In our ‘In Charts’ series, we work to tell some of the stories that are moving the industry. Feel free to take a look at the other articles by clicking here.
You can keep track of the markets daily through Agronometrics, a data visualization tool built to help the industry make sense of the huge amounts of data that professionals need to access to make informed decisions. If you found the information and the charts from this article useful, feel free to visit us at www.agronometrics.com where you can easily access these same graphs, or explore the other 20 fruits we currently track.


Subscribe to our newsletter


