


Peru’s fruit sector races to new heights


International Agricultural Trade Report by the USDA's Foreign Agricultural Service


Peru’s fruit exports have grown quickly during the last decade, rising from just $540 million in 2010 to $3.8 billion in 2020, with Peru ranking in the world’s top 10 fruit exporting countries since 2017. Although Chile remains the dominant Southern Hemisphere exporter, Peru has caught up with other major Southern Hemisphere suppliers Ecuador and South Africa.
Grapes, blueberries, and avocados drive Peru’s fruit exports, followed by steady citrus and mango gains. In 2020, the United States and the EU-28 accounted for more than 75 percent of Peru’s exports, while China, Hong Kong, and Canada each account for about 5 percent.
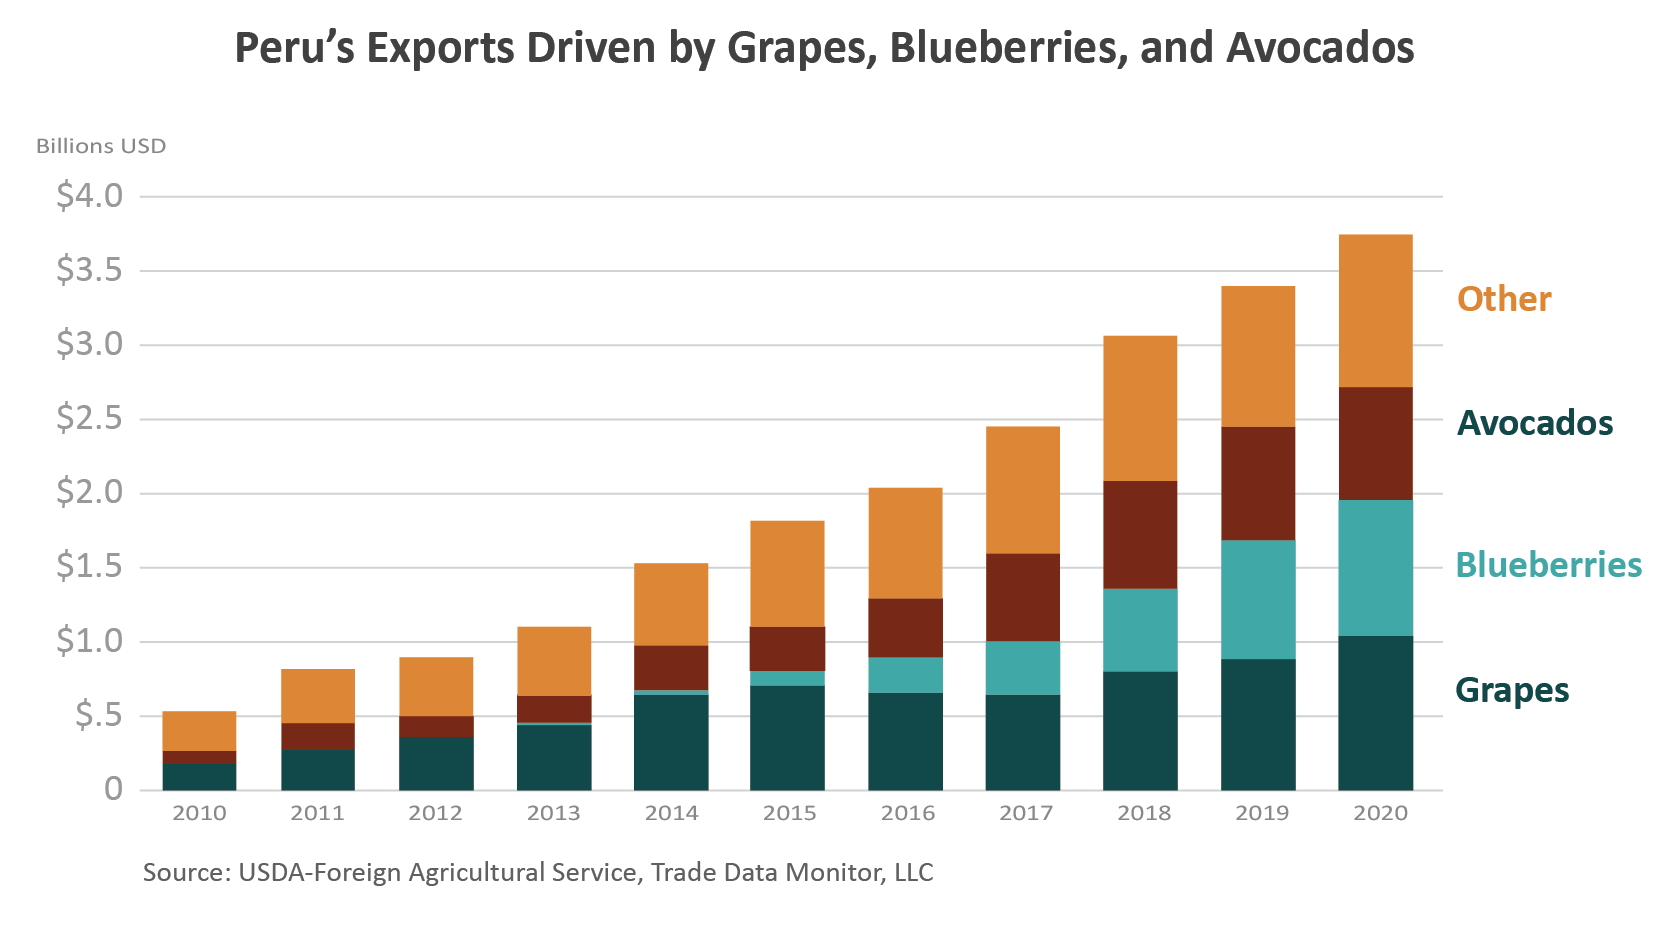
Table Grapes1
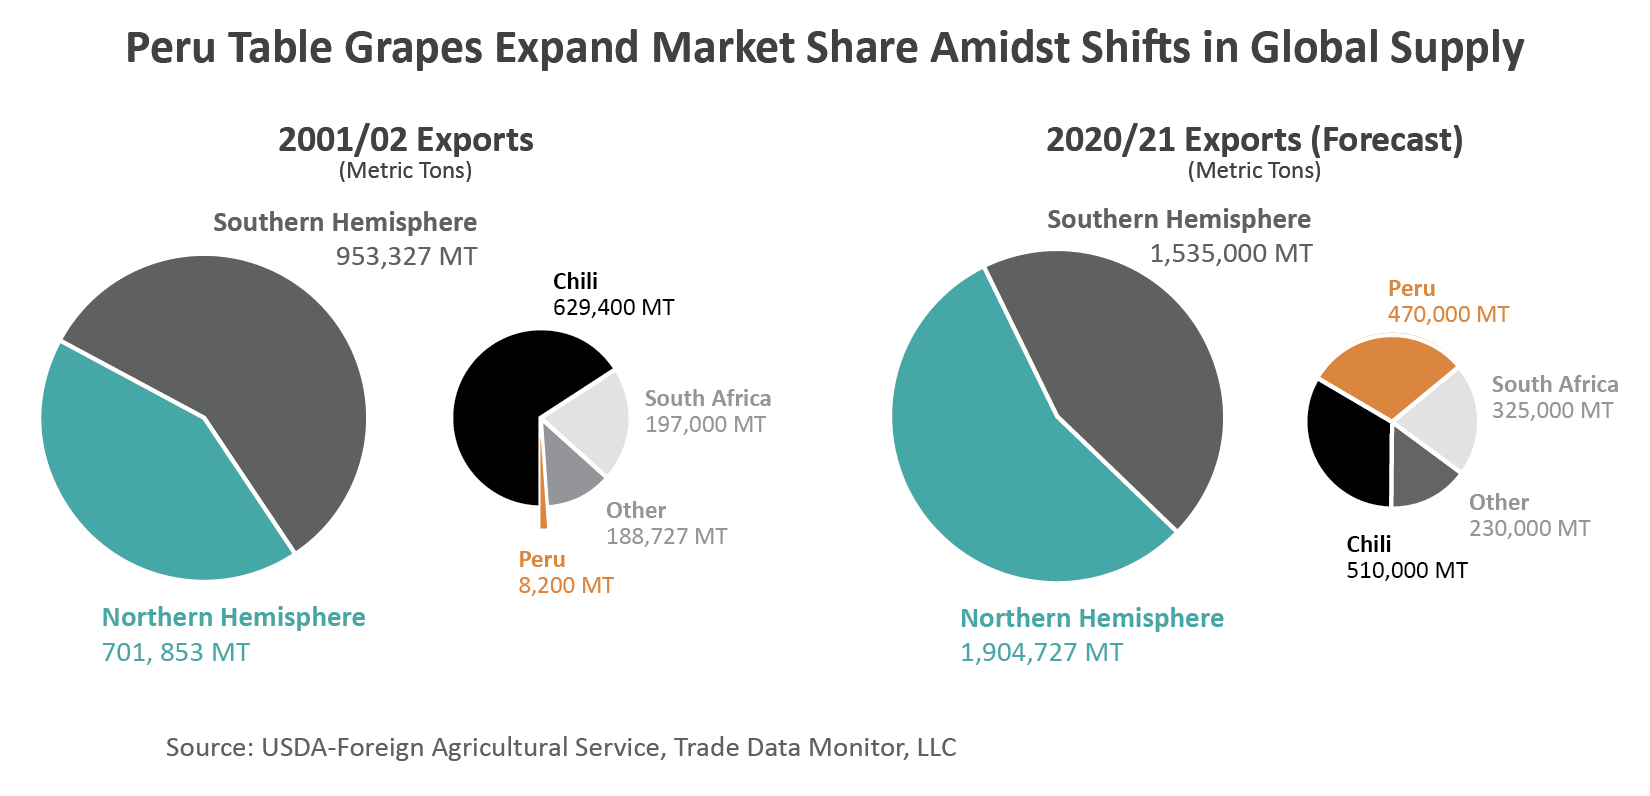
Global exports of table grapes, grapes intended for fresh consumption, have been increasing steadily for decades. Fueled by strong growth in consumer demand, world exports have more than doubled since 2001 to a forecast of 3.4 million tons in 2020. While the Southern Hemisphere, led by Chile, used to dominate world trade, the last decade has produced significant changes.
Northern Hemisphere exports have risen by more than 160 percent and the area now supplies more than half of the world’s grape exports led by producers from China, India, Mexico, and Turkey. In contrast, Southern Hemisphere exports have grown by just 60 percent. Chile continues to be the dominant world supplier, exporting hundreds of thousands more tons than other countries, but the emergence of Peru as a key supplier has caused a significant shift in influence among Southern Hemisphere suppliers.
Table grape production in Peru occurs predominantly in two areas along the coast: Ica in the south (41 percent) and Piura in the north (22 percent). Ideal growing conditions, including precision irrigation and a consistent 12 hours of sunlight per day, expedite vine maturation, enabling Peru to respond to market demand and quickly adopt improved varieties. Peru’s production has experienced almost non-stop growth since at least 2001, increasing nearly five-fold to a forecast 665,000 tons in 2020/21.
Exports have seen a similar rise, forecast up to 470,000 tons in 2020/21 and boosted export dependency to more than 70 percent. For perspective, even though China produces 16 times more grapes than Peru, both countries exported nearly the same amount for the past decade. In 2010, they both exported nearly 90,000 tons, and this parallel track has continued up to 2020.

Peru overtook South Africa as the second-largest Southern Hemisphere supplier by volume in 2013, and it continues to make inroads on Chile’s market share. In 2001, Peru accounted for less than 1 percent (8,200 tons) of Southern Hemisphere shipments, compared to Chile’s 66 percent (629,400 tons) and South Africa’s 21 percent (197,000 tons). By 2019, Peru’s share had grown to 27 percent (399,800 tons valued at $937 million) while Chile’s had contracted to 40 percent (605,000 tons valued at $926 million) and South Africa’s slipped to 20 percent (297,8000 tons valued at over $500 million).
Peru ships to more than 50 countries, including more than 10 in Asia, with top markets United States and the European Union accounting for 42 and 23 percent, respectively, of total table grape exports in 2019. At the same time, Peru is the third-largest supplier to the United States. In 2018, U.S. imports by volume from Peru nearly surpassed those from Mexico, historically the second-largest supplier to the United States.
Peru’s shipments arrive predominantly in the off-season but overlap with product arriving from top supplier Chile. In the past 5 years, the value of U.S. table grape imports from Peru has more than doubled to exceed $480 million in 2019, with value increasing on average by more than $65 million per year. U.S. imports from Peru have grown continuously since 1999, boosting Peru’s market share to a record 24 percent in 2019, while Chile’s has fallen from 76 to 42 percent.
Peru was the world’s second-largest exporter in 2019, behind Chile. So far, “steady-as-she-goes” is the byword for Peru’s table grapes industry as acreage continues to expand and ideal growing conditions enable quick maturation of ever-improving varieties.
Blueberries
Blueberries are one of the world’s most compelling fruit stories as production and exports are driven ever higher by mounting consumer demand. Blueberries have proven to be a versatile food, touted for both its taste and health benefits. They range in form from fresh to powdered, appearing as ingredients and additives throughout the menu from appetizers to desserts, as well as in beverages, snacks, and health-and-nutrition products.
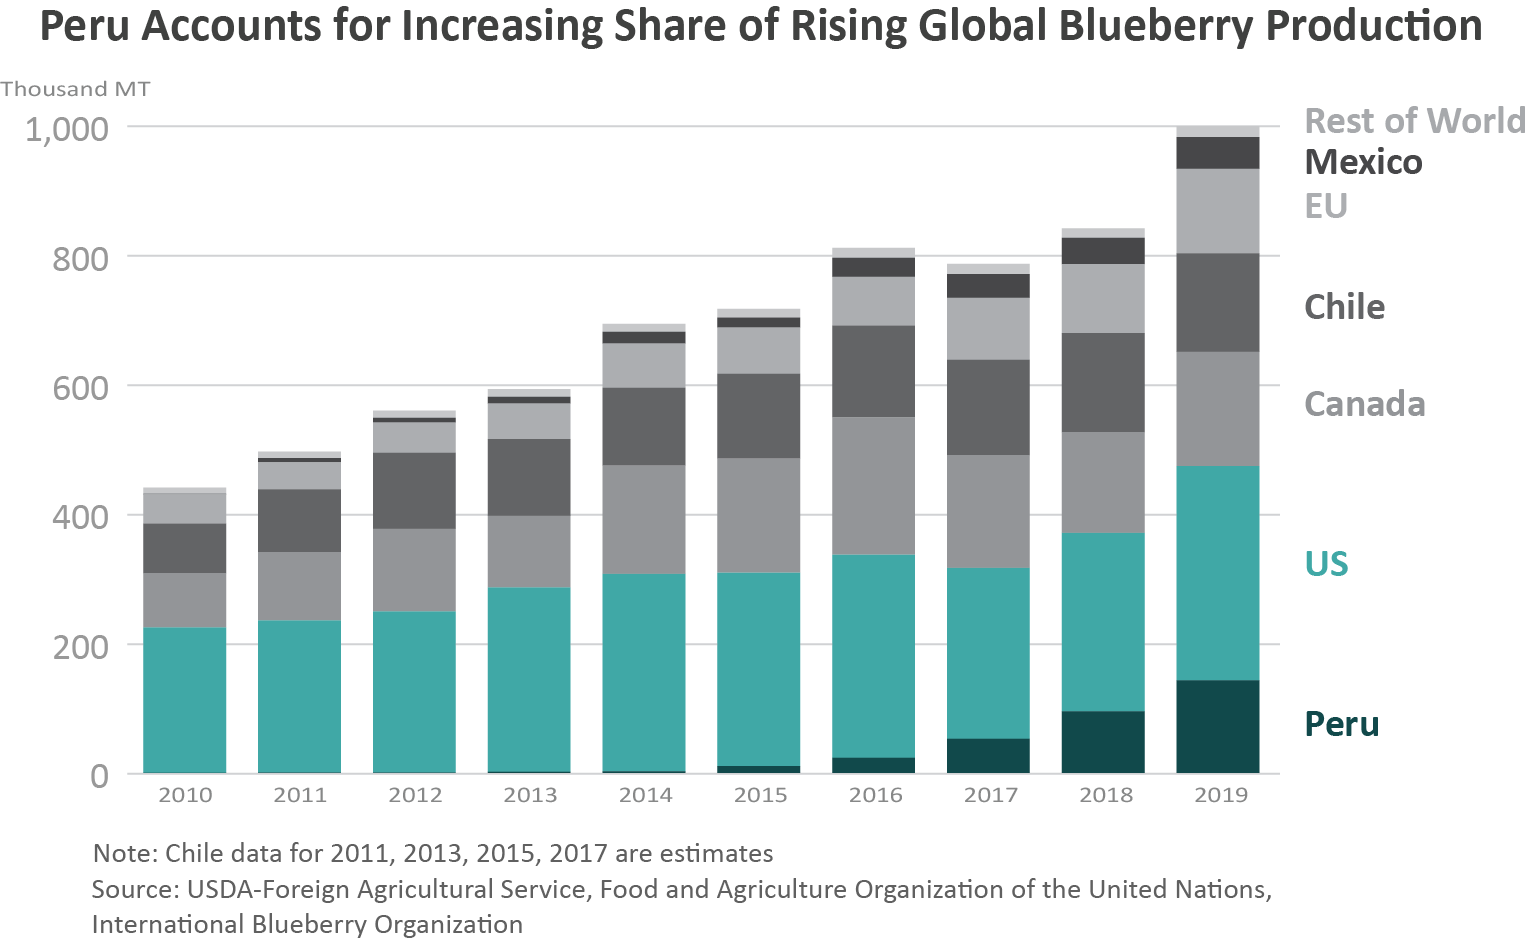
Production is branching out internationally as product development expands its profile in form and function. These new uses and forms are combining with growing fresh consumption to drive up production world-wide. Enabled by advances in genetics and production practices, blueberries were grown in at least 30 countries in 2019, in a variety of climates, and on all continents except Antarctica. Global production2 more than doubled between 2010 and 2019.
Of the 26 individual countries producing blueberries in 2010, at least 20 had shown growth by 2019. During that time, Peru had the most dramatic growth to become the fourth-largest producer behind the United States, Canada, and Chile.
Blueberries in Peru are grown predominantly in the northern coastal region of La Libertad, approximately 8 degrees below the equator, where the climate allows for almost year-round production. Growing area is expanding beyond this hot and dry climate as blueberries are now also being successfully grown in the higher altitudes and cooler temperatures of the central Andes.3
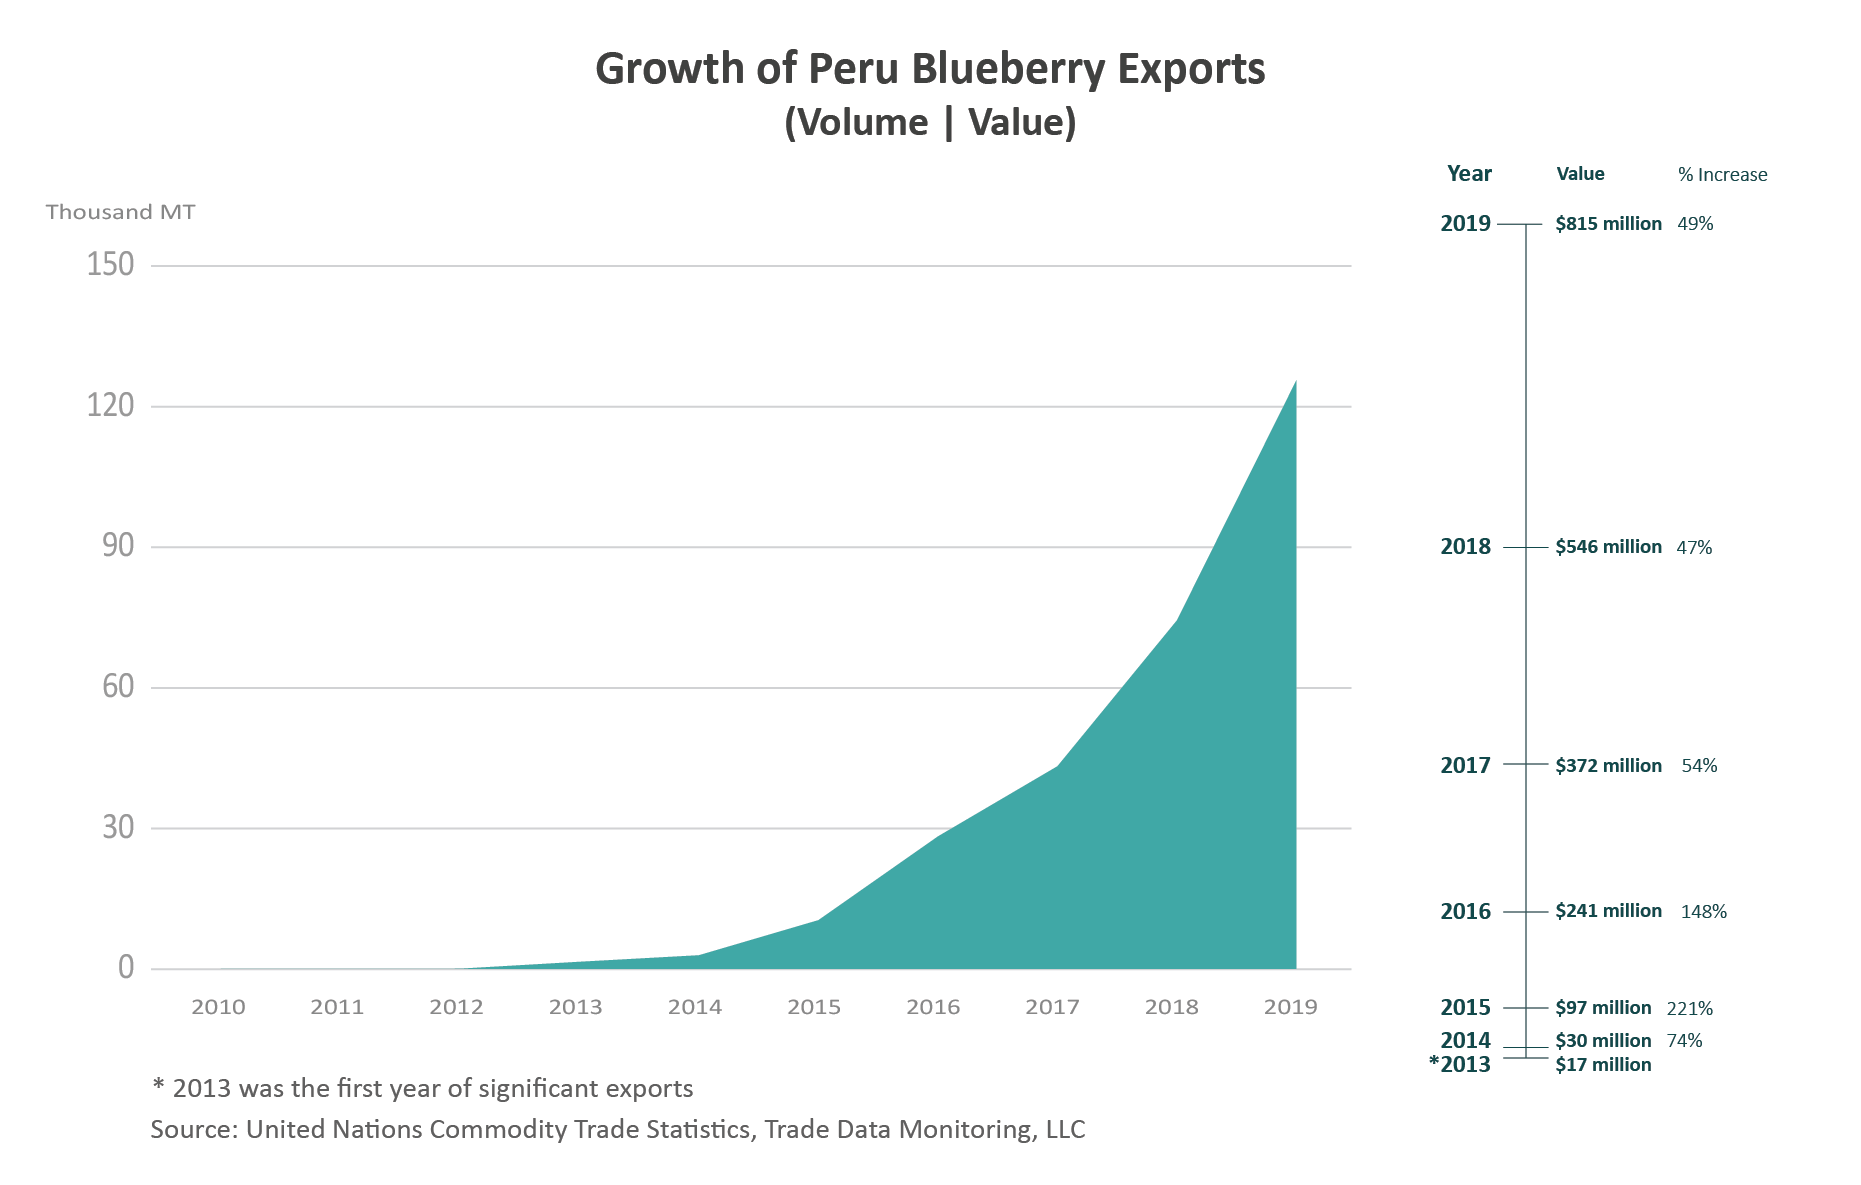
Production is almost solely for exports as high prices limit demand from domestic consumers. According to United Nations Commodity Trade Statistics, Peru started exporting fresh blueberries in minimal quantities in 2010. Between 2010 and 2019, both production and exports have grown from nearly zero to more than 140,000 and 125,000 tons, respectively, with 2019 exports valued at more than $800 million.
The launching point for Peru’s blueberry trade occurred in 2013 when exports broached $1 million for the first time, surging from nearly $500,000 in 2012 to more than $17 million in 2013. The United States also became Peru’s top market in 2013, with shipments reaching nearly $7 million, up from $34,000 in 2012.
The United States is the world’s leading blueberry grower, and U.S. production has seen similar growth, rising from 224,000 tons to 330,000 between 2010 and 2019. But with U.S. product typically available only March through October, imports of fresh blueberries have grown to meet consumer demand for year-round supplies. Though recent years show rising import volumes during months where U.S. and foreign supplier seasons overlap, most shipments arrive counter-cyclical to the U.S. season.
Since 2016, shipments to the United States have accounted for more than half of Peru’s total exports on average with the bulk of shipments arriving September through February. Peru became the top U.S. supplier of fresh blueberries in 2019, with U.S. imports valued at more than $485 million (69,000 tons), rising for the eighth straight year in 2020 to $516 million (84,000 tons).
Peru’s other top markets in 2020 were the EU (valued at $305 million; predominantly to the Netherlands and UK) and China (valued at $70 million). Peru exported blueberries to more than 30 countries in 2020. As consumer awareness of blueberries expands globally, demand is expected to rise, further driving Peru’s increase in production and exports.
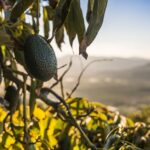
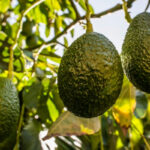
Avocado
Peru’s avocado production tripled in the last decade to total 550,000 tons in 2020. Hass and Fuerte are the principal types of avocados grown in Peru, with more than 95 percent of Hass production exported, while Fuerte primarily satisfies domestic consumption. Avocado output is centered along the desert coast, with the regions of La Libertad and Lima accounting for more than 40 percent of total output.
Most growers source water from the Andes via federal water canals to irrigate their orchards. Production occurs primarily between April and June, similar to other Southern Hemisphere countries such as Chile and South Africa.
Peru’s avocado industry has grown in direct response to overseas demand from the EU-28 and the United States, with total exports increasing from just $85 million in 2010 to more than $750 million in 2020. Peru’s exports to the United States and EU-28 have been facilitated by duty-free access through free trade agreements signed in 2009 and 2012, respectively. Also, Peru’s Hass Avocado Board collects $0.025 per pound to fund marketing activities strengthening its position in the market.
Mango
Although Peru’s mango production has held steady at around 500,000 tons during the last decade, exports have become increasingly important to the industry, rising from 125,000 tons in 2011 to 225,000 tons in 2020. In 2020, Peru exported $136 million of mangoes to the EU-28, followed by $69 million to the United States. Advantageously, the harvest is concentrated between December and March, with competitors Brazil, Mexico, and Thailand largely shipping before or after this period.
Production is mainly concentrated in the Piura, Lambayeque, and Ancash regions, and the main varieties grown include Kent, Haden, and Tommy Atkins, which have favorable characteristics for export markets. In the last few years, additional acreage has mostly been added in the Lambayeque region.
Citrus
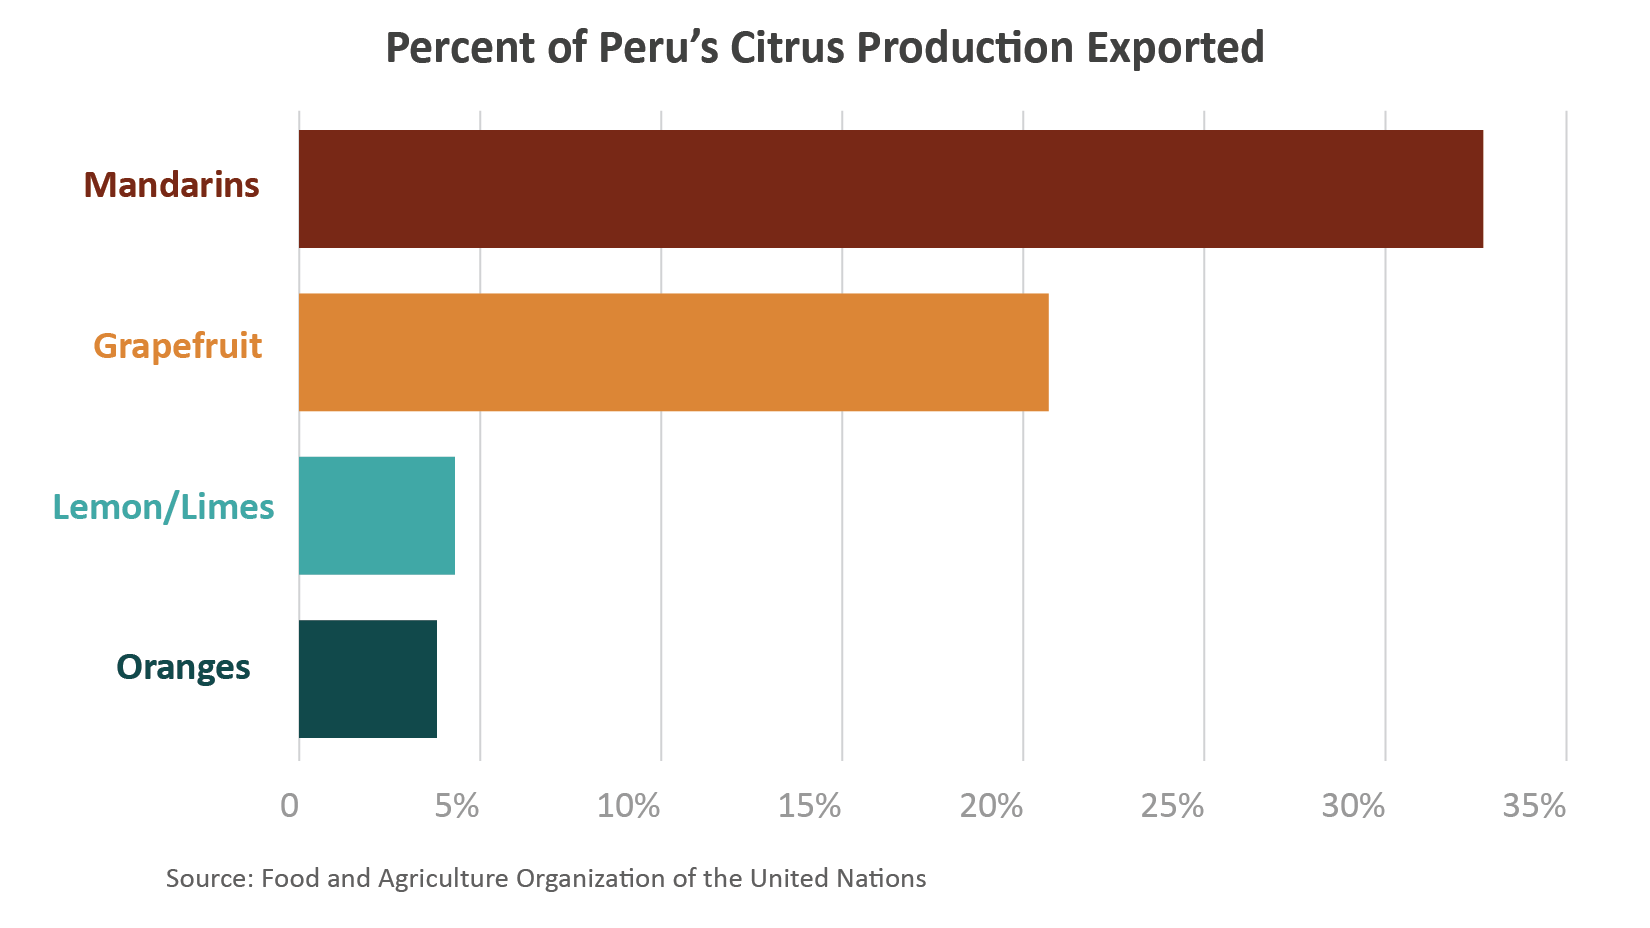
Citrus area harvested in Peru has been trending higher, reaching more than 75,000 hectares in 2018. USDA area harvested data is not available, but according to FAO data, citrus area harvested took a dip in 2019 to 65,000 hectares (2020 data is estimated up). Exports have also trended up with the increasing area harvested, doubling during the last 5 years to total 260,000 tons in 2020 ($275 million). Peru exports around 15 percent of the domestic citrus produced.
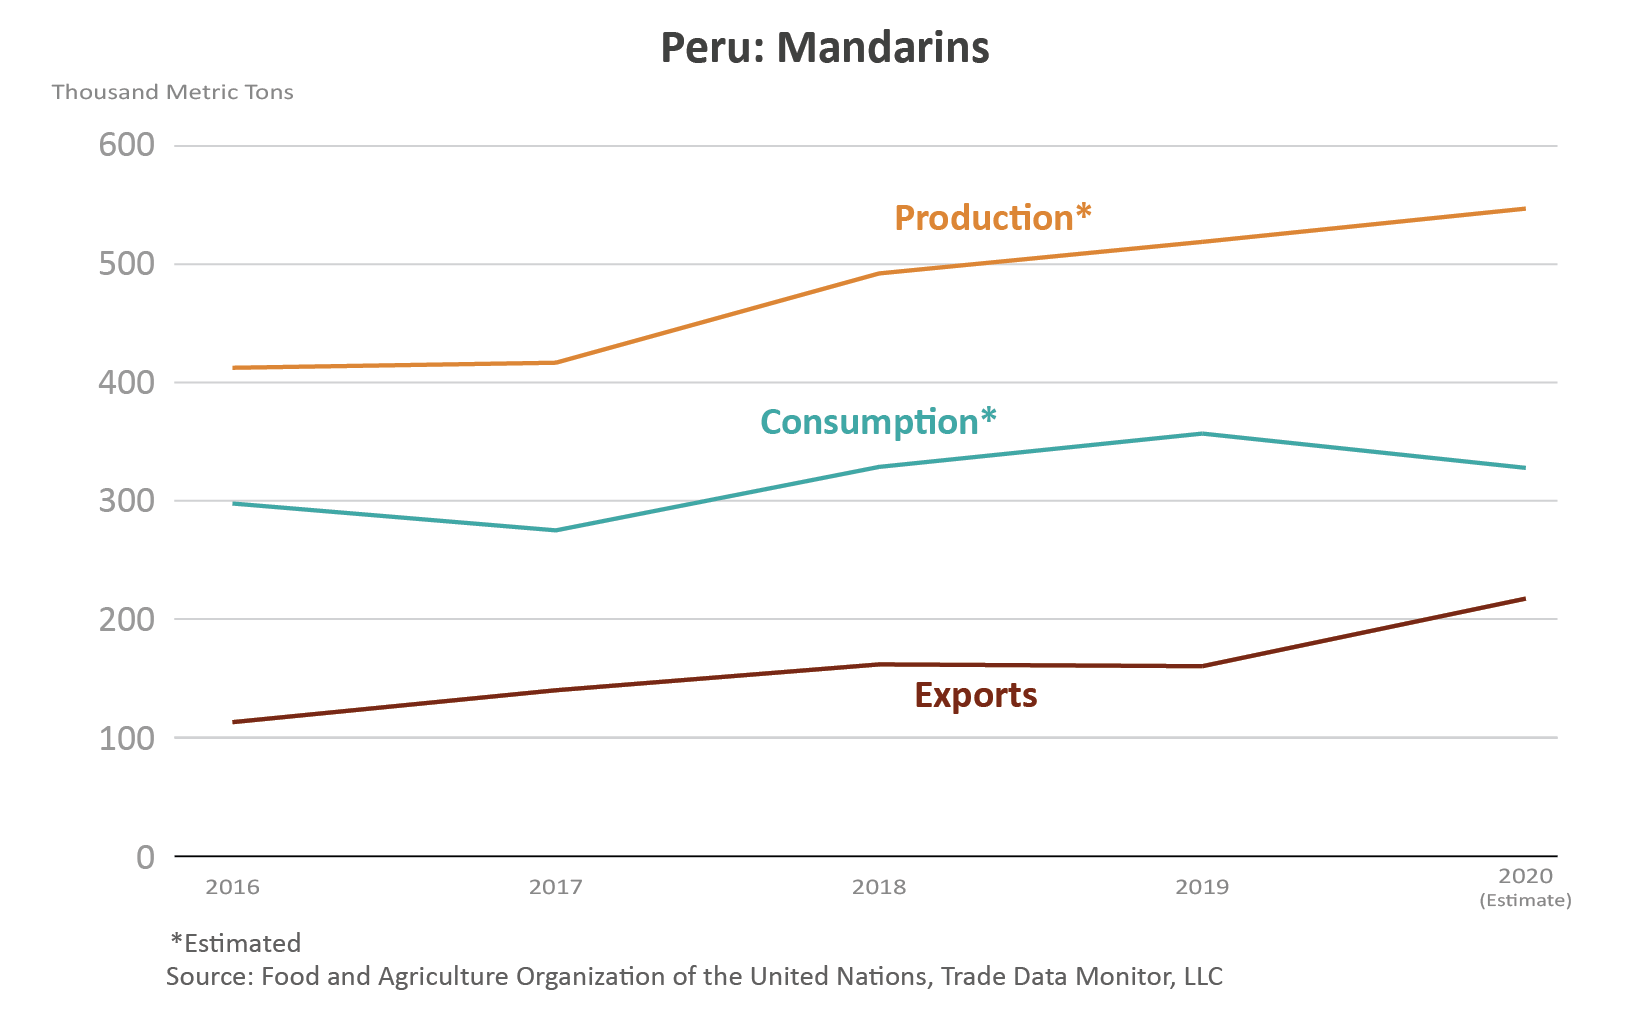
Mandarins
Peru represents less that 2 percent of global mandarin production which is about 10 percent higher in 2020/21 than 5 years ago, growing from 28.9 million tons to 33.1 million. Production in Peru has risen by one-third during the last 5 years from 400,000 tons in 2016 to an estimated 535,000 tons in 2020. Area harvested grew from nearly 15,000 hectares in 2016 to around 17,000 hectares in 2018 but slipped in 2019.
Global consumption also increased 10 percent during the last 5 years while consumption in Peru averaged around two-thirds of available domestic supply.
Global exports grew by almost one-quarter during the last 5 years to 3 million tons in 2020. Peru’s exports nearly doubled during the last 5 years from 112,000 tons ($135 million) in 2016 to 214,000 tons ($248 million) in 2020; data is not available prior to 2016. The United States is the top destination for Peruvian mandarins accounting for more than one-third of exports in 2016 to nearly half of exports in 2020.
U.S. demand for mandarins continues to grow with consumption increasing by nearly one-third during the last 5 years. The EU-28 is the second largest destination with more than 25 percent of the exports in 2020. The marketing season for Peru’s mandarins ranges between March and October each year, which provides a window of opportunity for export during the Northern Hemisphere counter-season.
Oranges
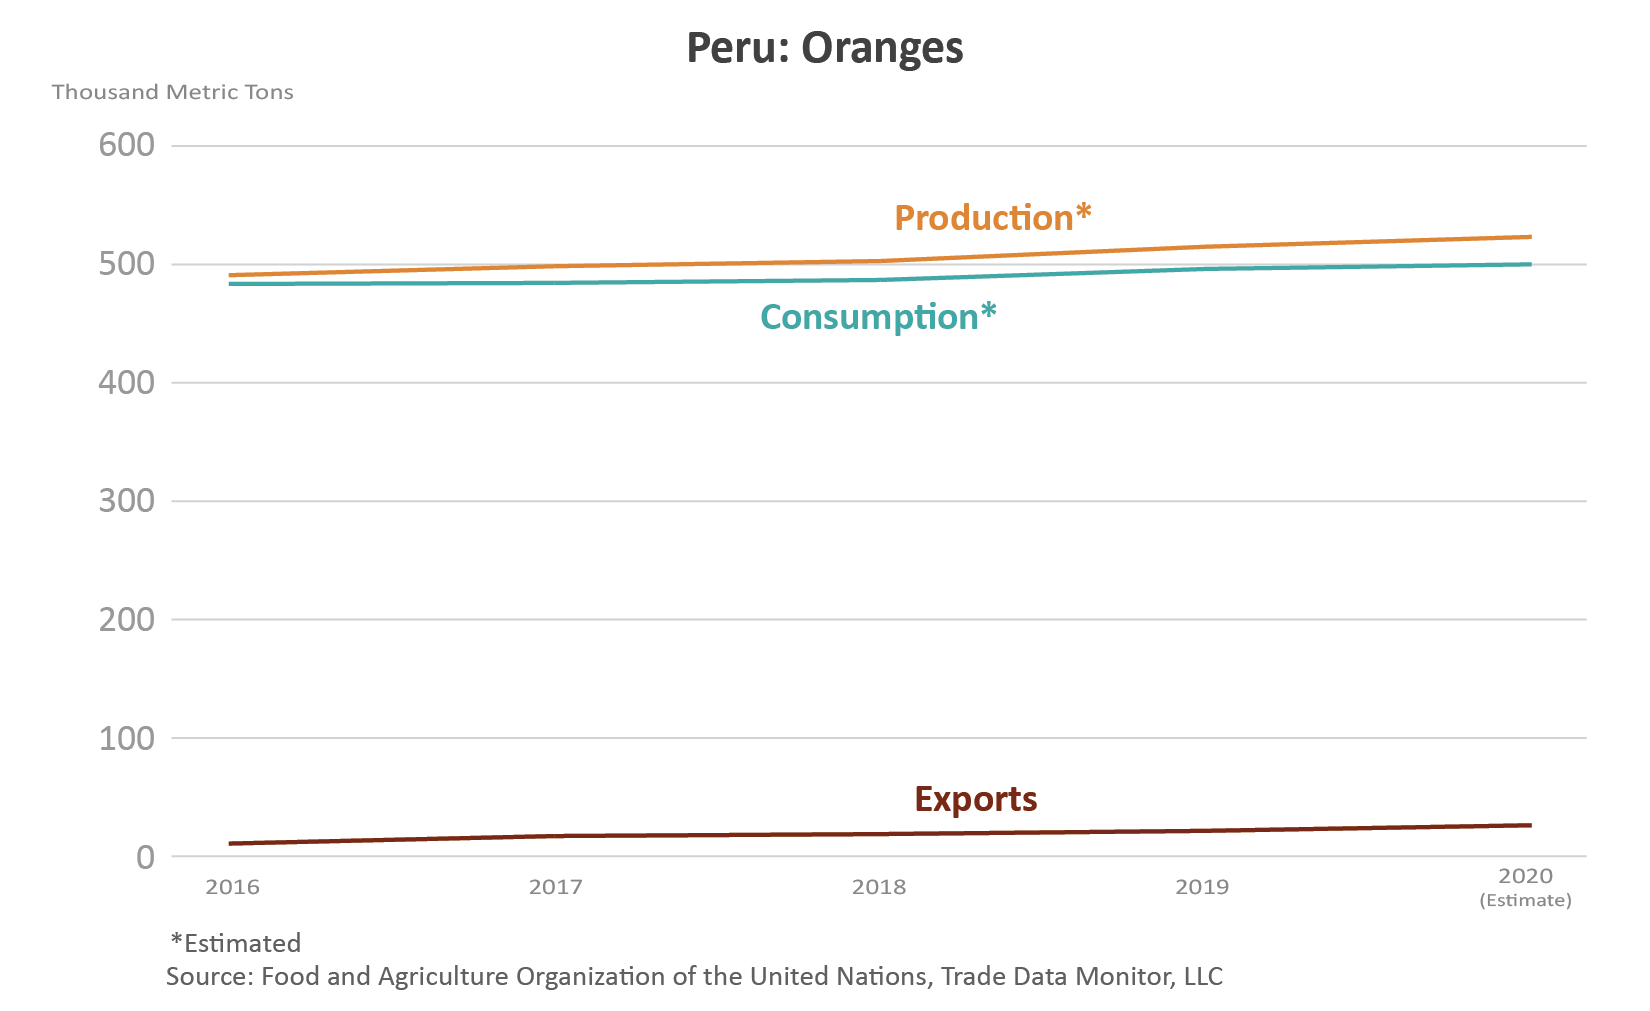
Peru represented about 1 percent of global orange production which has been consistent during the last 5 years averaging 50 million tons, with alternate bearing on years and off years. Production in Peru has grown from 456,000 tons in 2016 to 515,000 tons in 2019 with area harvested dropping 16 percent in 2019, according to FAO data. Production and area harvested data for 2020 is estimated.
Global consumption has been flat during the last 5 years at around 29 million tons. Consumption in Peru is around 95 percent of available domestic supply.
Global exports have grown 2 percent since 2016 to 4.6 million tons. Peru’s exports have more than doubled in the last 5 years from 11,000 tons ($4 million) in 2016 to 26,000 tons ($11 million) in 2020 and are expected to continue to rise; data is not available prior to 2016. The EU-28 is the top market for Peruvian oranges with an average of 90 percent of exports. Exports to the United States have grown from 0 to 335 tons since 2016. The marketing season for Peru’s oranges ranges between June and November each year, which, similar to mandarins, provides a window of opportunity for export during the Northern Hemisphere counter-season.
Lemons/Limes
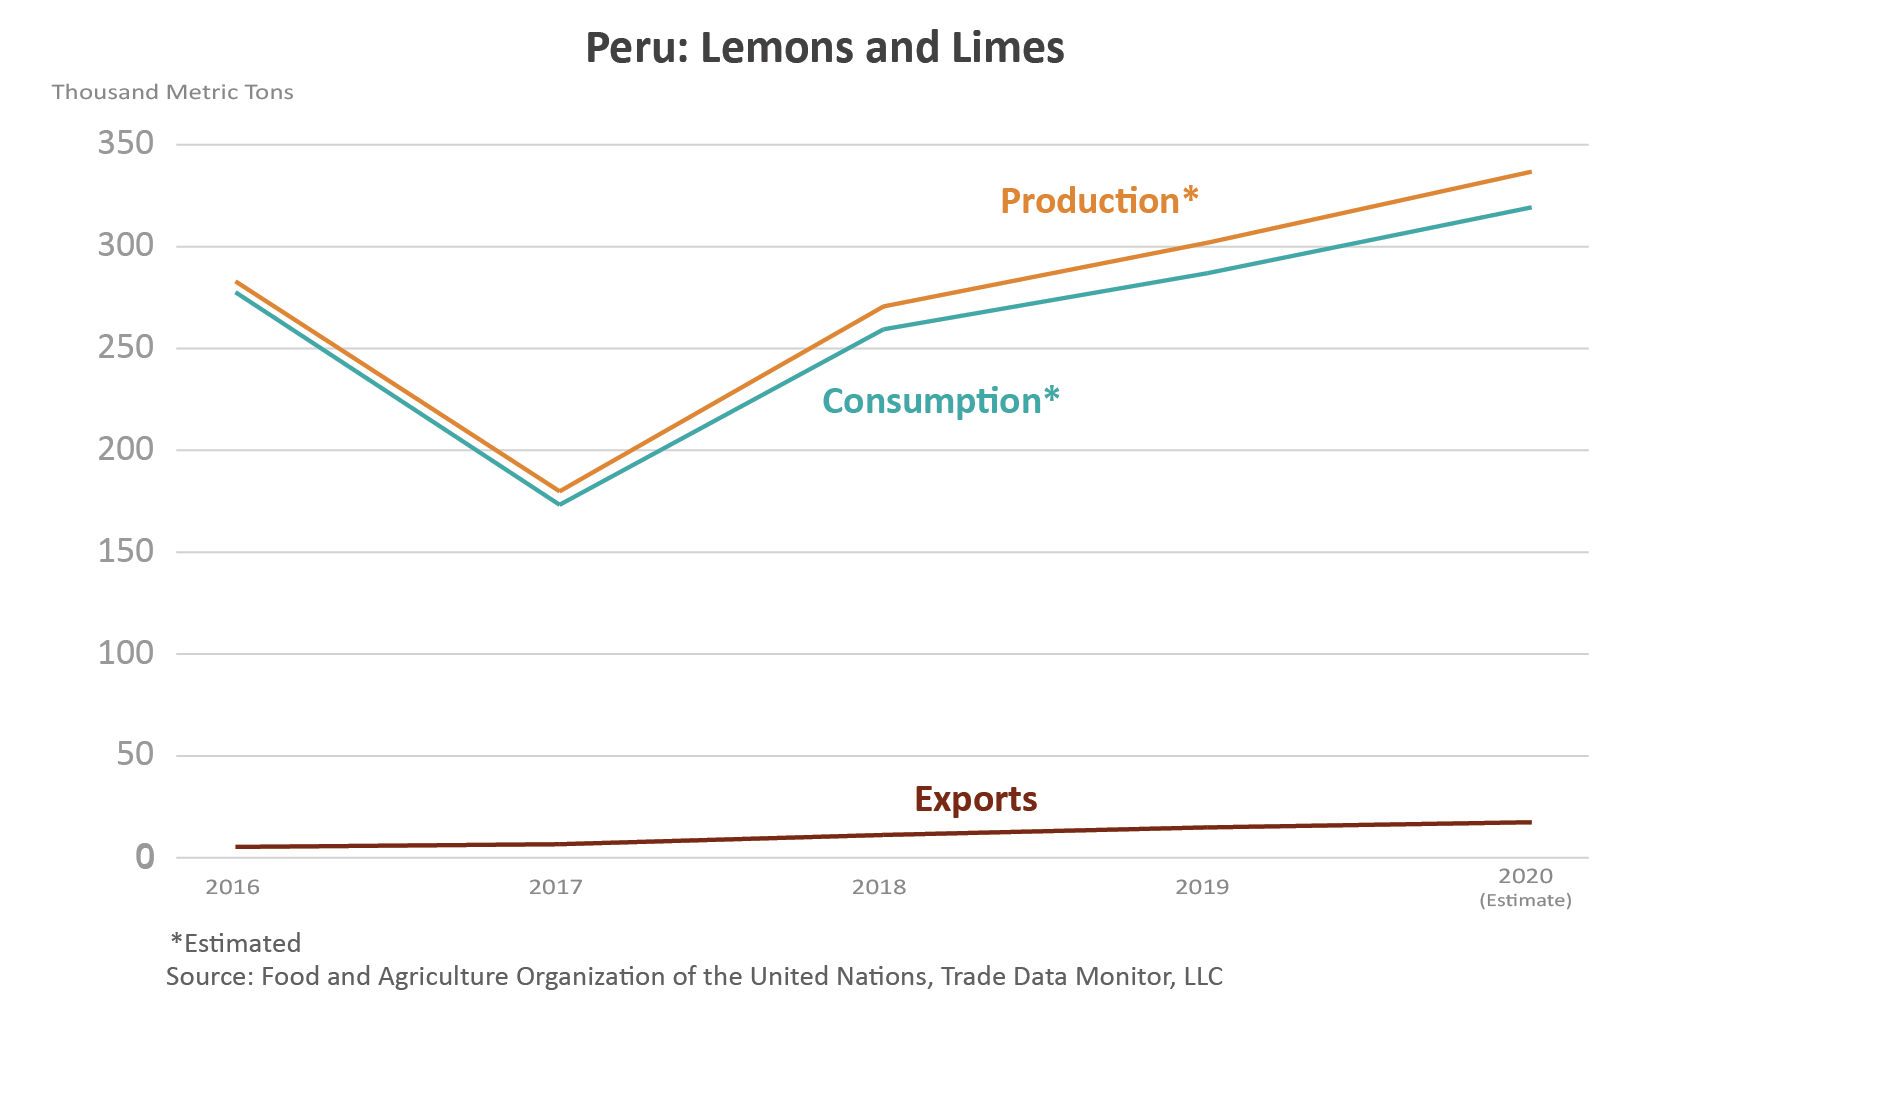
Peru represents about 4 percent of global lemons/limes production which has expanded 7 percent during the last 5 years growing from 7.0 million tons to 8.3 million in 2020/21. Production in Peru has grown 7 percent since 2016 to the 2020 estimate of 337,000 tons. Area harvested has mostly been flat since 2016 averaging more than 26,000 hectares.
Global consumption rose 17 percent since 2016/17 and is forecast at 6.5 million tons in 2020/21. Consumption in Peru is around 95 percent of available domestic supply.
Global exports have grown 9 percent since 2016/17 to 2.2 million tons while Peru’s exports have more than tripled going from more than 5,350 tons ($5 million) in 2016 to 17,500 tons ($14 million) in 2020; data is not available prior to 2016. Chile is the top market for Peruvian lemons/limes accounting for 50 percent of the exports in 2020, down from three quarters of exports just 3 years earlier. In 2020, the EU-28 was the second largest market accounting for nearly 20 percent of exports while the United States accounted for 5 percent of exports. The marketing season for Peru’s lemons/limes is year-round.
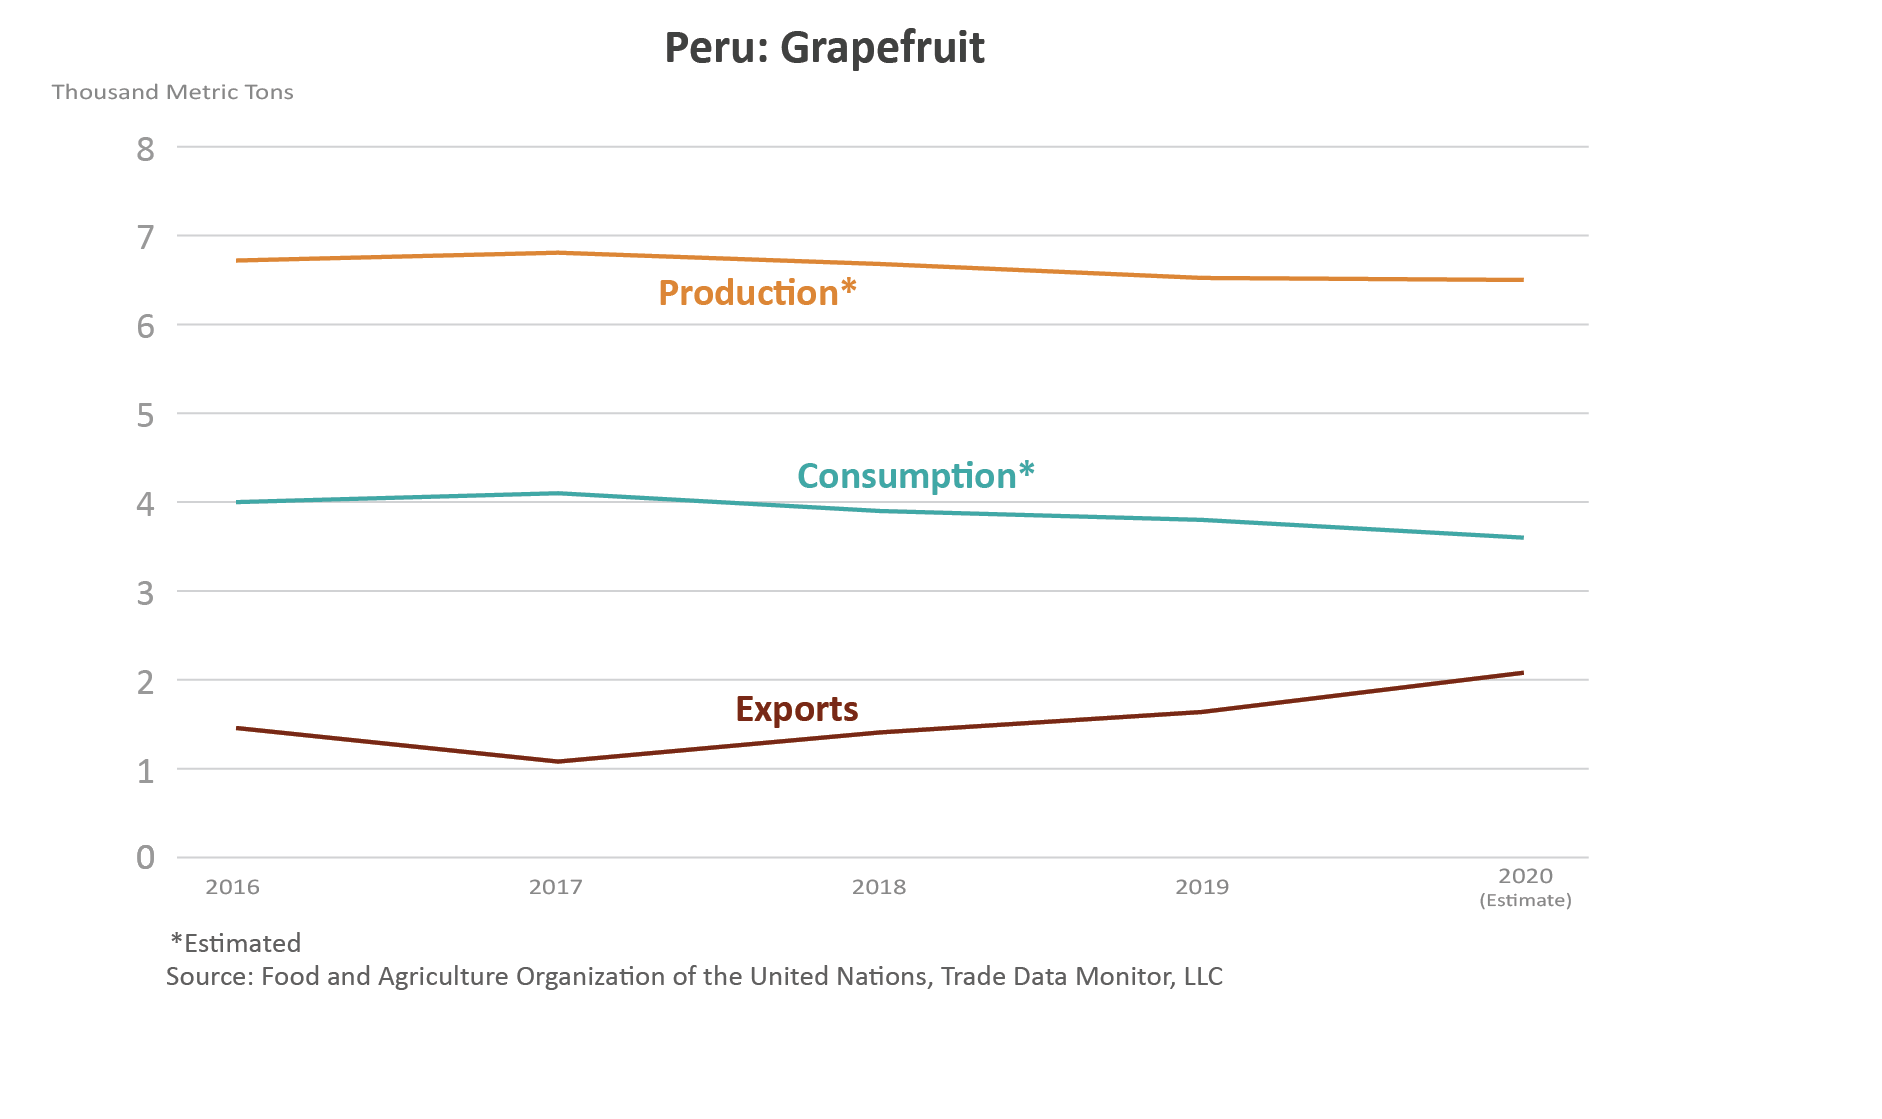
Grapefruit
Although only about one-quarter percent of global exports, Peru’s grapefruit exports have gone up more than 40 percent since 2016 with the United States as the top market and China close behind. Grapefruit production in Peru is a very small portion of global production with area harvested averaging around 850 hectares. Consumption in Peru has averaged just under 60 percent of available supply. The marketing season for Peru’s grapefruit ranges between June and September, which, similar to oranges and mandarins, provides a window of export opportunity during the Northern Hemisphere counter-season.
1 Note on reference years for table grapes: years are the first year of a split marketing year (Southern Hemisphere countries = October-September; United States, China = May-April).
2 Source: U.S. Department of Agriculture; International Blueberry Organization, 2020 “State of the Industry Report, Americas”; Food and Agriculture Organization of the United Nations (FAO).
3 USDA/Foreign Agricultural Service/Office of Agricultural Affairs, Lima, Peru


Subscribe to our newsletter