


Agronometrics in Charts: How much more volume can the U.S. avocado market absorb?


In this installment of the ‘Agronometrics In Charts’ series, Cristian Crespo F. illustrates how the U.S. market is evolving. Each week the series looks at a different horticultural commodity, focusing on a specific origin or topic visualizing the market factors that are driving change.


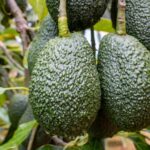
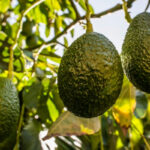
If there is any fruit whose consumption is a worldwide trend, it's avocados. Its popularity, in addition to its delicious taste, is mainly due to the characteristics and benefits it has for human health. The consumption of the so-called "green gold" is increasing in some markets and there are those who say that in the future the price of avocados will exceed that of gold.
However, the price of avocados in the U.S. market has remained fairly constant over recent years. For example, the average price of the Hass variety in the North American market in 2000 was US$2.40 per kilogram, while in 2020, the average price was $2.90 per kilogram, as shown in the graph below.
Historic Avocado Prices (Price by Variety)| USD/KG

(Source: USDA Market News via Agronometrics) [Agronometrics users can view this chart with live updates here]
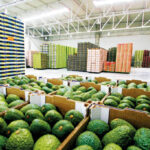
Hass avocado supplies in the U.S. come mainly from Mexico, California, Chile, Peru and Colombia. Despite the explosive increase in avocado arrivals from Mexico, which are on the way to breaking records, their prices have remained fairly stable as is shown in the graph below. This can only be explained by an increase in consumption and demand for avocados in the North American market.
Historic Avocado Volumes (KG)
(Source: USDA Market News via Agronometrics) [Agronometrics users can view this chart with live updates here]
Faced with the above, the question arises: How much more volume will the U.S. market be able to absorb as it's on track to exceed more than 1.3 million kilograms at the end of 2021?
The answer seems to be given in consumption which continues to set records, and where events like Cinco de Mayo or the Super Bowl take place when avocado consumption in the form of guacamole is already a classic.
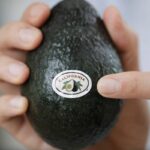
Additionally, it's necessary to observe what happens with Mexican exports very closely. As well as with countries that are increasing in production and exports of avocados, such as Peru, and origins that recently began their exports such as Colombia.
In our ‘In Charts’ series, we work to tell some of the stories that are moving the industry. Feel free to take a look at the other articles by clicking here.
You can keep track of the markets daily through Agronometrics, a data visualization tool built to help the industry make sense of the huge amounts of data that professionals need to access to make informed decisions. If you found the information and the charts from this article useful, feel free to visit us at www.agronometrics.com where you can easily access these same graphs, or explore the other 20 fruits we currently track.


Subscribe to our newsletter