


Agronometrics in Charts: Soaring strawberry volumes from california feeding an ever voracious demand


In this installment of the ‘Agronometrics In Charts’ series, Sarah Ilyas studies the progression of the Strawberry season in California. Each week the series looks at a different horticultural commodity, focusing on a specific origin or topic visualizing the market factors that are driving change.


Strawberries are an integral constituent of the berry category in U.S. supermarkets regardless of the season; the fruit represents 60 percent of the sales volume and contributes over $3.4 billion in annual sales to the produce department in the US.
California fresh strawberry production this season is trending ahead of last year with soaring yields and acreage. Growers in California recently added 6 percent more acreage compared to the previous year.
Current FOB and fresh market pricing as a result have been the lowest they have been in over a year. High consumer demand has propelled the rate of imports and has stimulated multi-year high acreage in California. As a consequence, strawberry availability is expected to increase in 2022, and prices are likely to maintain steady rates.
“Fair weather has been contributing to some early production especially in Southern California, so we are currently ahead of 2021 and ahead of our three year average,” says Chris Christian, Senior Vice President of the California Strawberry Commission. Peak production for California is expected at the end of March and early April, according to Chris.
In the meanwhile, demand has climbed considerably. According to a recent national survey, nearly one-third of the consumers named strawberries as their favorite. Volumes from Southern Calıfornia in Week 10 stood at around 5.8 K tonnes while those from Central California were at around 1.6 K tonnes.
Strawberry Volumes By Origin in the US

(Source: USDA Market News via Agronometrics. Agronometrics users can view this chart with live updates here)
Demand for strawberries has been higher than ever, the US market absorbed over 2 billion pounds of fresh strawberries recently, however, problems such as exorbitant labor and packaging costs still persist and have been deliberated on frequently within the California Strawberry Industry.
The California Strawberry commission recently launched a new campaign called “Love Strawberries”, which is aimed at increasing awareness about the industry.
Current prices for strawberries from California, according to the USDA Specialty Crop Market News, stand at around $8 (low) - $14(high) per package.
Some growers, due to the lower prices, may begin diverting a portion of their harvests to processing in order to prevent a surplus of the fruit reaching cold storage. Week 10 saw prices at around $9.53 per package, a 22 percent drop compared to last year.
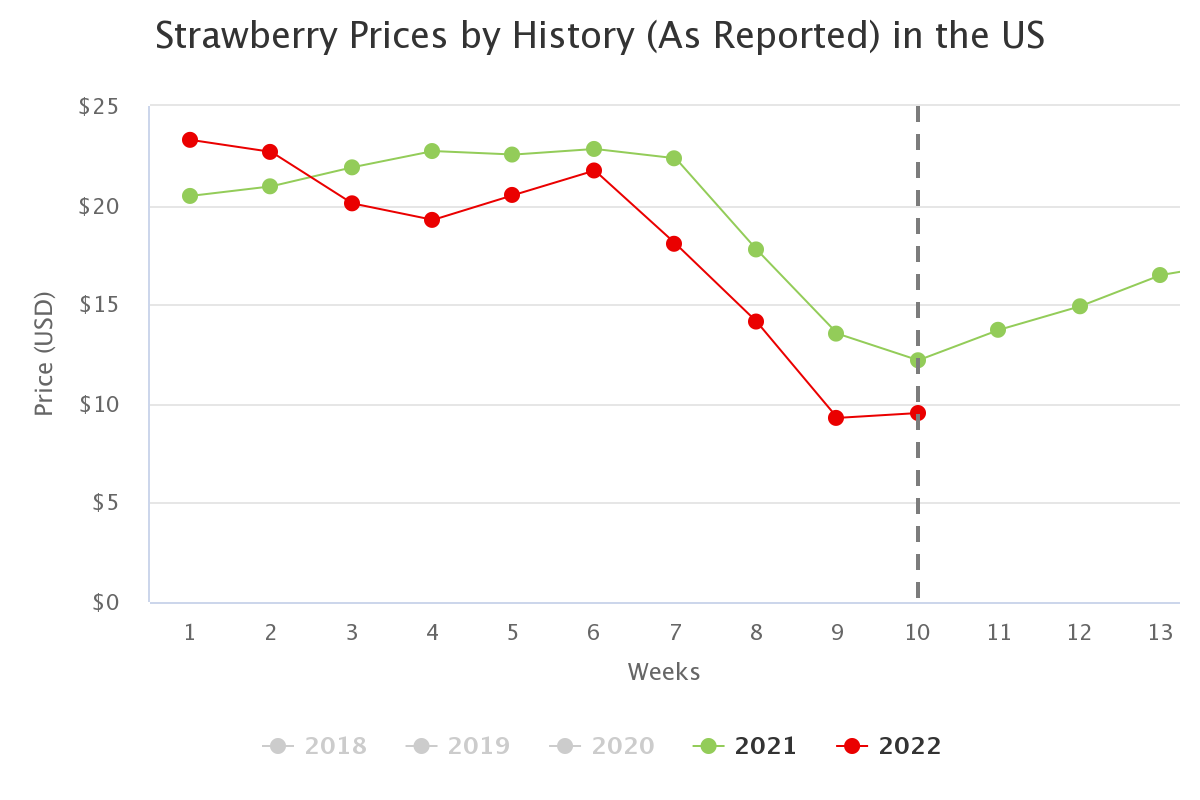
(Source: USDA Market News via Agronometrics. Agronometrics users can view this chart with live updates here)
This year saw volumes from Mexico culminating at 13 K tonnes while those from Florida peaked at around 12.4 K tonnes in early March. It may be a while before volumes reduce enough to cause a hike in fresh strawberry market prices, owing to continued imports from Mexico, and a sizable production in Florida this year. In order for prices to go up, production in one of these areas would have to scale down appreciably.

(Source: USDA Market News via Agronometrics. Agronometrics users can view this chart with live updates here)
In our ‘In Charts’ series, we work to tell some of the stories that are moving the industry. Feel free to take a look at the other articles by clicking here.
All pricing for domestic US produce represents the spot market at Shipping Point (i.e. packing house/climate controlled warehouse, etc.). For imported fruit, the pricing data represents the spot market at Port of Entry.
You can keep track of the markets daily through Agronometrics, a data visualization tool built to help the industry make sense of the huge amounts of data that professionals need to access to make informed decisions. If you found the information and the charts from this article useful, feel free to visit us at www.agronometrics.com where you can easily access these same graphs, or explore the other 21 commodities we currently track.


Subscribe to our newsletter