


Agronometrics in Charts: Peru ascending as the world’s leading grape exporter


In this installment of the ‘Agronometrics In Charts’ series, Sarah Ilyas studies the progression of the Peruvian grape season and evaluates its implications for the US grape market. Each week the series looks at a different horticultural commodity, focusing on a specific origin or topic visualizing the market factors that are driving change.


A hike of about 12% is expected for Peruvian grape exports this season; according to projections by the Association of Table Grape Producers of Peru (Provid), approximately 64 million boxes of table grapes (8.2 kilograms each unit) will be exported by the end of the season; this would be the first time that Peru would export more than sixty million boxes of table grapes in one campaign.
Although Peru’s acreage didn’t witness a dramatic increase this year, plantations made two seasons ago matured and boosted overall production, almost doubling export volume. “Weather conditions were excellent and the start of the harvest was as expected in early November and ended as planned in mid-March,” said Dirk Winkelmann, Vanguard Direct president in an industry publication.
The height of the season, in week 4, saw a total of 27 K tonnes making its way into the US market, displaying a 56 percent surge compared to the previous year. Varieties constituting the remaining harvests include Red Globe, Green Seedless and Red Seedless hailing from the Ica region.
Markets that were previously, rather rigidly classified as “Red Globe only” have developed a predilection for IP varieties, owing to their high demand and low susceptibility to sudden slumps in the market. As noted by Provid, growth seen so far has primarily been due to varietal diversification; this season witnessed a 37 percent increase in white seedless varieties and 22 percent increase in red seedless shipments, through to January.
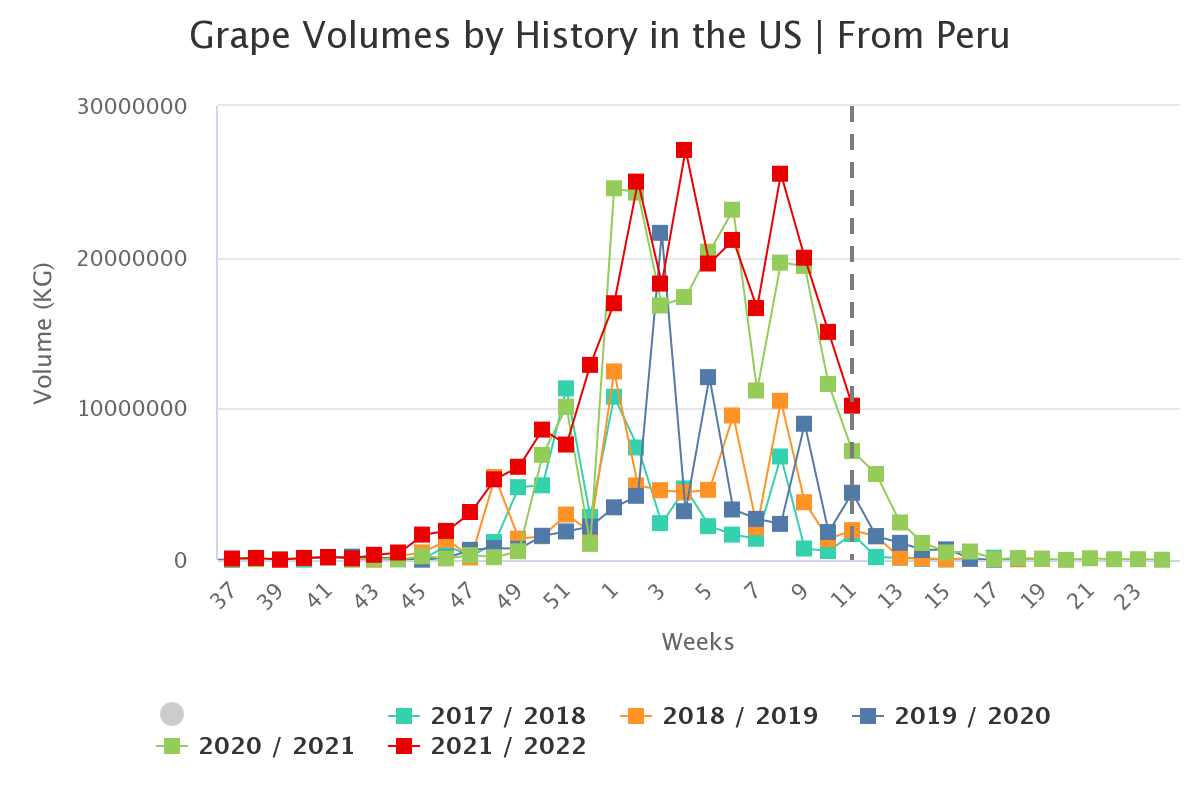
(Source: USDA Market News via Agronometrics. Agronometrics users can view this chart with live updates here)
This season has witnessed its fair share of tribulations. Issues such as exorbitant input costs, lack of containers at crucial junctures during the harvest, deferments in vessel departures, extended transit times, port congestion and delayed container discharges have been plaguing the Peruvian grape industry for a while.
Despite these constraints, this season saw an influx of Peru table grapes. Fernando Cillóniz Benavides of a reputable consulting firm, projected that the marked difference between the previous and current season would be apparent by the end of March. He went on to claim that nearly 10 million kilos were shipped in March 2021, while the first four days of March this year saw exports of over 8 million kilos.
Despite soaring volumes, prices have not taken a hit compared to last year, contrary to expectations. The peak prices recorded this season were in week 1, at $31.77 per package. Week 11 saw prices dropping to $19.72 per package, a slump of around 16 percent compared to week 11 of 2021.

(Source: USDA Market News via Agronometrics. Agronometrics users can view this chart with live updates here)
Peru table grape exports reached US$ 1.26 billion in 2021, registering an increase of 22 percent when compared to the previous year. According to Peru’s Ministry of Foreign Trade and Tourism (Mincetur), Peru surpassed Chile (US$ 928 million), as the world’s main grape supplier, followed by the U.S. (US$ 782 million) and China (US$ 757 million). Despite impediments, Peru has managed to position itself as one of the world’s leading exporters of fresh grapes.
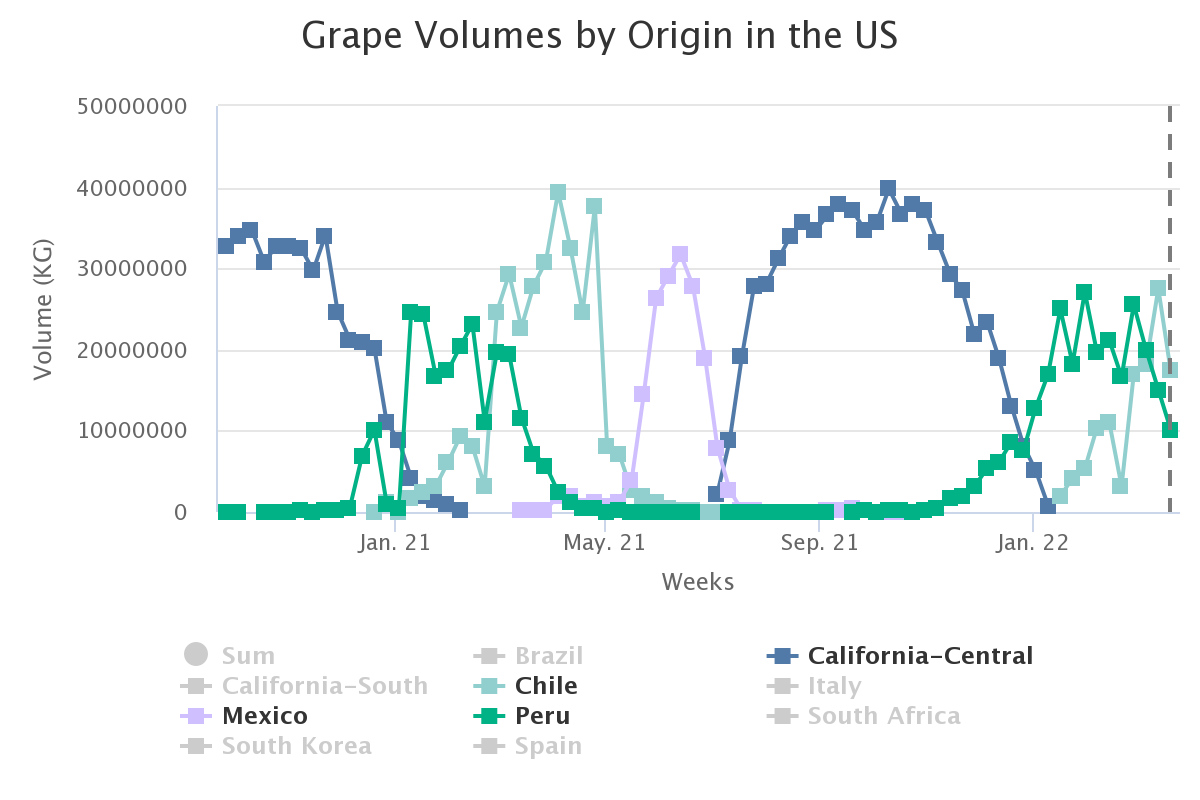
(Source: USDA Market News via Agronometrics. Agronometrics users can view this chart with live updates here)
In our ‘In Charts’ series, we work to tell some of the stories that are moving the industry. Feel free to take a look at the other articles by clicking here.
All pricing for domestic US produce represents the spot market at Shipping Point (i.e. packing house/climate controlled warehouse, etc.). For imported fruit, the pricing data represents the spot market at Port of Entry.
You can keep track of the markets daily through Agronometrics, a data visualization tool built to help the industry make sense of the huge amounts of data that professionals need to access to make informed decisions. If you found the information and the charts from this article useful, feel free to visit us at www.agronometrics.com where you can easily access these same graphs, or explore the other 21 commodities we currently track.


Subscribe to our newsletter