


Agronometrics in Charts: Citrus volumes from Chile set to tumble by up to 12%


In this installment of the ‘Agronometrics In Charts’ series, Sarah Ilyas studies the state of the Chilean citrus market. Each week the series looks at a different horticultural commodity, focusing on a specific origin or topic visualizing the market factors that are driving change.


The Chilean citrus season kicked off recently with the first shipment of clementines to the United States. Mandarins, navel oranges and lemons are soon to follow. The forecast for the current citrus season in Chile stands at 45,000 tons of clementines, 120,000 tons of tangerines, 90,000 tons of oranges and 90,000 tons of lemons.
A 12% decline from 2021 is cumulative citrus volumes from Chile is expected due to issues such as unconducive weather, logistical difficulties and hikes in freight costs that are impacting global citrus volumes.
Additionally, a 35% decrease in clementine volumes is anticipated this season. Around 88% of all Chilean citrus exports were directed towards the United States in 2021; 97% of the clementines and mandarins.
Chilean growers might be facing a challenging season, but it has grown into an incrediblly strong, year round category, increasing by 25 percent over the past five years with future growth opportunities, said Juan Enrique Ortuzar, president of the Chilean Citrus Committee in an industry publication. The chart below depicts this increase. As can be noted, the highest volumes recorded for the previous season were around 130 K tonnes for tangerines, 94 K tonnes for oranges, 64 K tonnes for lemons and 48 K tonnes for clementines.

(Source: USDA Market News via Agronometrics. Agronometrics users can view this chart with live updates here)
As for mandarins, the Chilean Citrus Committee projects a season quite similar to the previous one. Thanks to new plantations, volumes are expected to reach 120,000 tons this year, 5 percent less than the previous season. It is early to provide precise estimates for lemons, however, a volume of 90,000 tons is currently projected, which is equivalent to 11 percent less than the previous season, according to Ortuzar.
The 2021 season saw pricing for lemons ranging from $31.11 in week 3 to 18.5 in week 34 and 35. As volumes projected for the current season are lower than the previous one, prices could be expected to be higher.

(Source: USDA Market News via Agronometrics. Agronometrics users can view this chart with live updates here)
As for oranges in 2021, prices ranged from $22.51 in week 40 to 19.82 in week 35.

(Source: USDA Market News via Agronometrics. Agronometrics users can view this chart with live updates here)
For clementines, prices in 2021 ranged from $22.65 in week 30 to 32.85 in week 37. Like oranges, pricing for Chilean clementines this season may be very similar to the pricing last season owing to projected volumes being almost equivalent to the volumes recorded for the previous season.

(Source: USDA Market News via Agronometrics. Agronometrics users can view this chart with live updates here)
The projected volume for Chilean tangerines this season is 120 K tonnes while the volume recorded in the previous season was 130 K tonnes. Pricing in the last season ranged from $32 per package in week 38 to $25.02 per package in week 48.
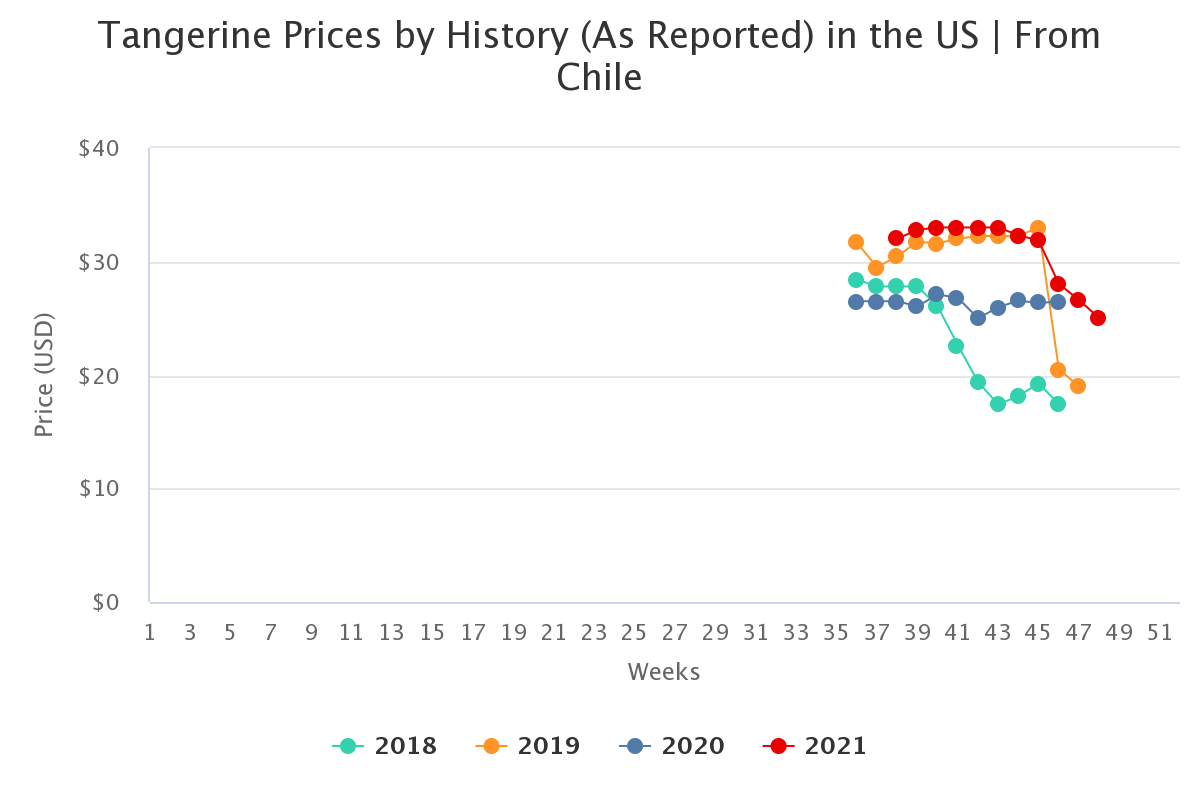
(Source: USDA Market News via Agronometrics. Agronometrics users can view this chart with live updates here)
The Chilean Citrus Committee is working on a new brand campaign that will focus on digital advertisements, virtual demonstrations and programs with shopping apps such as Shopkick. The committee will also implement in-store programs that highlight the flavor, nutrition and convenience of Chilean citrus. “This season, perhaps more than ever, it is crucial that we work closely with the trade on flexible and targeted programs to drive sales,” says Karen Brux, director of marketing for the Chilean Fresh Fruit Association.
In our ‘In Charts’ series, we work to tell some of the stories that are moving the industry. Feel free to take a look at the other articles by clicking here.
All pricing for domestic US produce represents the spot market at Shipping Point (i.e. packing house/climate controlled warehouse, etc.). For imported fruit, the pricing data represents the spot market at Port of Entry.
You can keep track of the markets daily through Agronometrics, a data visualization tool built to help the industry make sense of the huge amounts of data that professionals need to access to make informed decisions. If you found the information and the charts from this article useful, feel free to visit us at www.agronometrics.com where you can easily access these same graphs, or explore the other 21 commodities we currently track.


Subscribe to our newsletter


