


Agronometrics in Charts: Indian mangoes swiftly recovering lost ground within the U.S. market


In this installment of the ‘Agronometrics In Charts’ series, Sarah Ilyas studies the state of the Indian mango market. Each week the series looks at a different horticultural commodity, focusing on a specific origin or topic visualizing the market factors that are driving change.


Export of Indian mangoes to the US was initiated recently, after a hiatus of two years and the volume of exports during 2022 is likely to surpass 1,095 million tonnes recorded in 2019-20 according to the Indian Ministry of Commerce and Industry.
Himan Chavada, chairman of Krish International, told an industry publication that demand for Indian mangos is always on the higher side, but that the yield for this year will be lower than past seasons, so prices will be tight but quality will be better.
India is so far the largest producer of mango contributing to 51% of the world’s total production. The peak mango season in India in 2022 is expected to range from April to July in the southwest and from June to July in the northern regions.
This year, Alphonso seems to be the most popular with end consumers. “We are also surprised, given Alphonso is the hardest to treat. Mostly, it is the sturdy Kesar which finds favor with exporters and consumers,” says Kaushal Khakhar, CEO of Kay Bee exporters, the largest fruits and vegetables exporter of the country.
Kesar is a favorite among exporters, given its longer shelf life and sturdiness. Alphonso is more difficult to treat owing to its thinner peel. Of the nearly 15 M mangoes harvested annually, India ships out around 100 K mangoes. Gujarat, Maharashtra, Karnataka and Uttar Pradesh are the prominent mango exporting states.
The season is soon to approach its peak, with volumes increasing steadily. Week 20 saw around 86 K kgs of mangoes arriving into the US market from India.
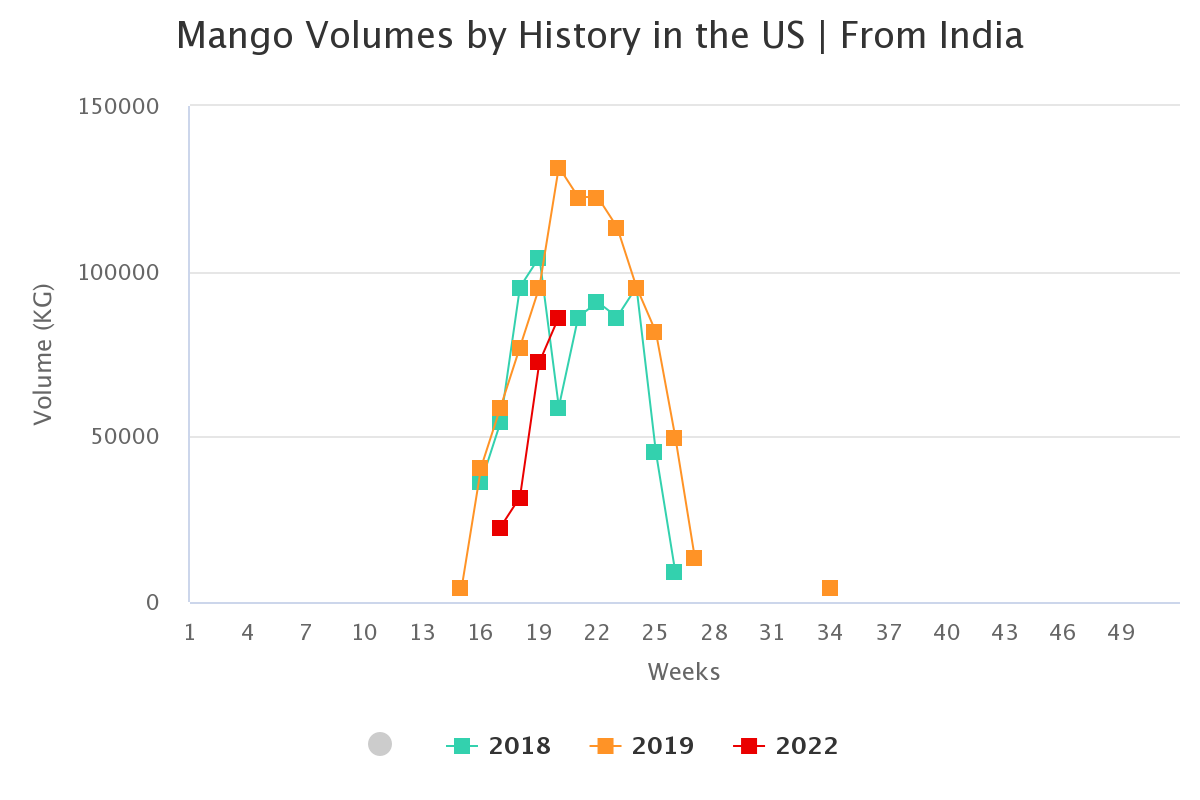
(Source: USDA Market News via Agronometrics. Agronometrics users can view this chart with live updates here)
Input material costs including those for packing materials, fuel, labor and machinery are at a record high. Ocean freight rates are expected to remain elevated throughout 2022 as disruptions pertaining to containers prevail.
Furthermore, unreliable weather conditions and late-flowering are causing delays in harvests. Owing to inclement weather, Mango production In India is lower compared to the previous years.
Himan Chavda also said that logistics have been a challenge, and costs for freight are high, which has an effect on the costs that exporters must deal with.
Air freight charges are currently as high as Rs 520-550/kg ($6.71-$7.10 per kg), compared to the earlier price of Rs 200-225/kg ( $2.58-$2.90 per kg).

(Source: USDA Market News via Agronometrics. Agronometrics users can view this chart with live updates here)
“We are primed to handle approximately 500 tons of mango shipments a week this year,” says Mohnish Arora, GM of perishable cargo trade at Jet Freight Logistics (JFL), a Mumbai-based niche air freight company.
“Given the perishability of the produce, reliable and faster transits are critical,” says one leading Mumbai-based mango exporter. “We are hoping to substantially increase our exports, but there are headwinds looming.”
According to Arora, several airlines that had reduced their workforce during the Covid-19 pandemic are now having difficulty getting back to full worker capacity and the current state of geopolitical affairs is causing fuel prices to skyrocket, thus pushing up carrier costs that would inevitably be passed on to cargo owners through hikes in rates or surcharges.
![]()
(Source: USDA Market News via Agronometrics. Agronometrics users can view this chart with live updates here)
In our ‘In Charts’ series, we work to tell some of the stories that are moving the industry. Feel free to take a look at the other articles by clicking here.
All pricing for domestic US produce represents the spot market at Shipping Point (i.e. packing house/climate controlled warehouse, etc.). For imported fruit, the pricing data represents the spot market at Port of Entry.
You can keep track of the markets daily through Agronometrics, a data visualization tool built to help the industry make sense of the huge amounts of data that professionals need to access to make informed decisions. If you found the information and the charts from this article useful, feel free to visit us at www.agronometrics.com where you can easily access these same graphs, or explore the other 21 commodities we currently track.


Subscribe to our newsletter


