
Peruvian blueberry market: Is this the land of confusion?


Guest article by Diego Castagnasso, a fresh produce and blueberry industry expert. Loud, opinionated, INFORMED! Diego writes DC’s B-Side’s newsletter as he speaks and speaks as he writes. You can subscribe, under your own peril, to his newsletter here or visit his less fun (for now) website Drip Consulting.

Genesis even wrote a song about it!
Much less grim than a Genesis song, when it comes to the Peruvian Blueberry market, things are not as clear as growers, exporters, and importers would want them to be.
But what is generating this confusion? Prices.
If you check the average prices for blueberries, they really don’t match what the markets are paying.
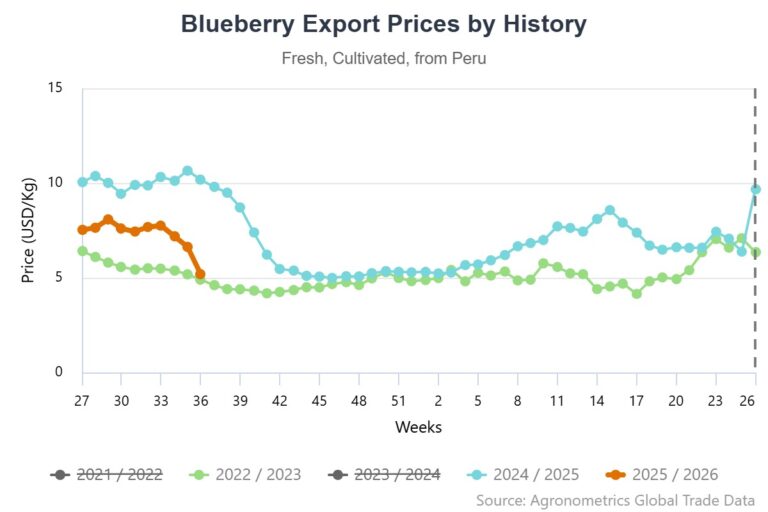
Source: Agronometrics
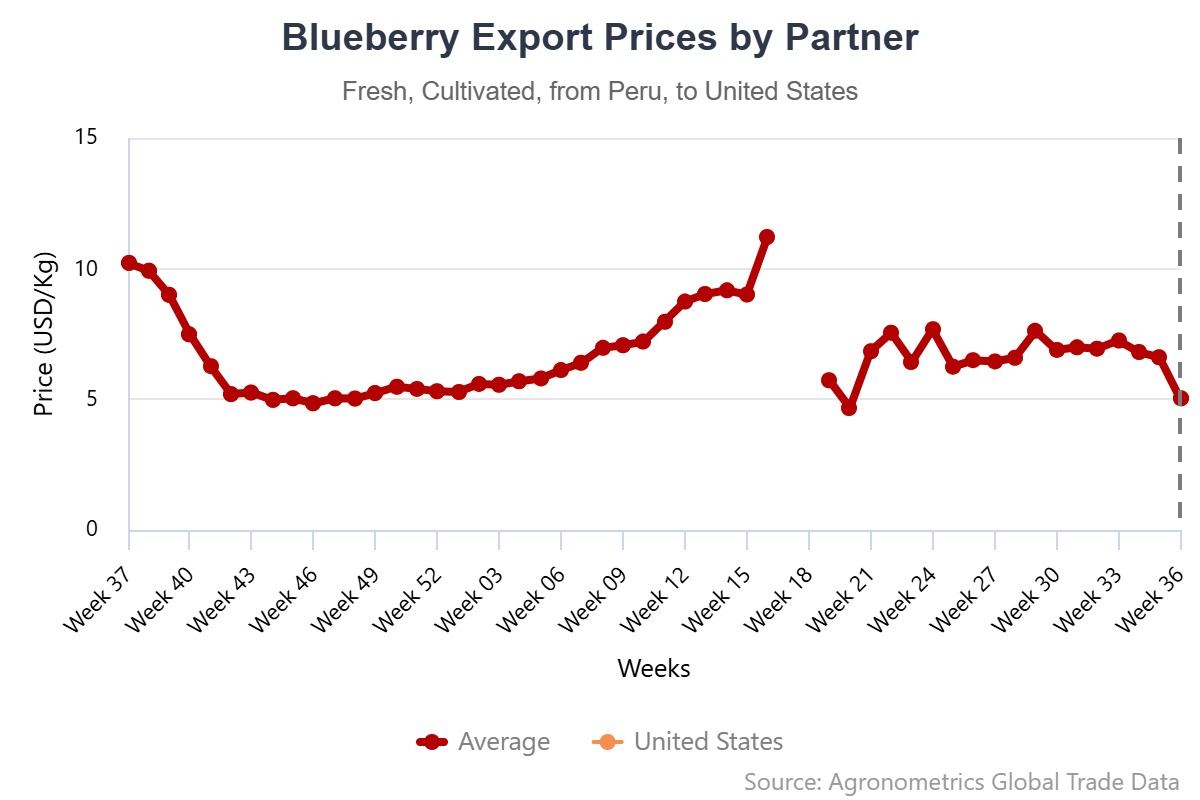
Source: Agronometrics
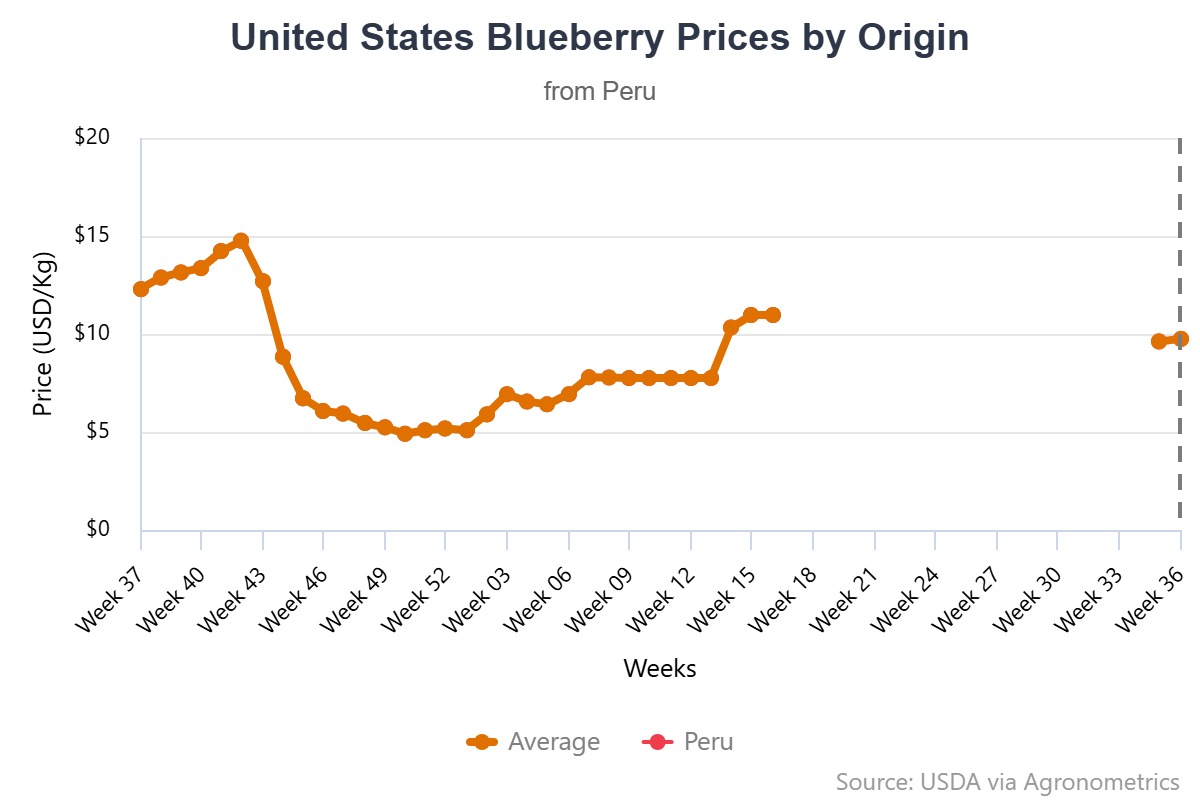
Source: Agronometrics
In Week 36, the average price for a kilo of blueberries was $5,19 FOB.
However, I know for a fact that it is challenging to buy quality Peruvian blueberries for that price, mainly because you’d need to order quite a large volume to get them.
Take the American market, for example. Peru shows prices for the US at $5.04 per kilo in Week 36. It seems consistent, but it isn’t. If you look at the other end of the equation, you’ll be surprised to see that a kilo of blueberries is going for $9.75 instead, which is more in line with what I am hearing on the ground.
Fortunately, Colin Fain from Agronometrics has an explanation for this, which is rooted in the way the information is managed. And it’s not just a theory, as I double-checked with a big Peruvian grower who offered the same thesis.
In the end, the situation will correct itself, but in the meantime, crossed messages are not helping when analyzing the current landscape.
Then we have the Volume Expectation. For most people, this metric is based on the information provided by the Proarandanos forecast, which in turn is built from the information the union organization gets from industry actors such as producers, colleagues, and consultants.
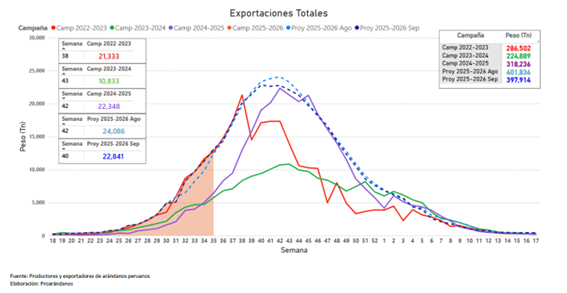
Source: Agronometrics
Here, forecasts went as follows:
- April: The peak was in Week 42 with a volume of 23,943 tons and a total volume of 403,009 tons for the season
- June: The peak was in Week 42 with a volume of 23.810 tons and a total volume of 401.227 tons for the season
- July: The peak was in Week 41 with a volume of 24.706 tons and a total volume of 405.240 tons for the season
- August: The peak was in Week 42 with a volume of 24.086 tons and a total volume of 401.836 tons for the season
- September: The peak was in Week 40 with a volume of 22.841 tons and a total volume of 397.914 tons for the season
The peak week volume across forecasts varies slightly, going between 22,841 tons and 24,706 tons.
The July forecast shows the highest peak week volume at 24,706 tons, approximately 8.2 percent higher than the September forecast peak week volume of 22,841 tons.
Total season volume projections fluctuate marginally from 397,914 tons (September) to 405,240 tons (July).
The July forecast total season volume is about 1.9 percent higher than the September forecast total volume.
April, June, and August forecasts are fairly close, with peak week volumes around 23,800 and 24,100 tons, while total volumes are near 401,000 tons. This translates to less than 1.5 percent variation among them.
Overall, the July forecast predicts the highest peak week and total season volume, with the September forecast showing the lowest values.
Here, something that makes folks uneasy is the change in the peak week. The problem might result from fruit coming into markets earlier than expected, causing disruption with retailers, who are not an “agile” bunch when it comes to changing their promotion dates.
To add a bit more “confusion” into the mix, I spotted a minor mistake in Proarandanos' Week 36 info.
Comparing Week 36 volume expectations from 2024 and 2025 (approximately 8.3 million kg vs 14.3 million kg), you’ll notice a 110 percent increase in the week’s volume. Unfortunately, even though numbers seemed right (I double checked with Agronometrics data), the year-on-year growth for Week 36 is not 110 percent, but closer to 71.87 percent.
Is this a life-or-death thing? Most certainly not, but it might make people’s work doing reports and projections a bit confusing if they don’t check the information from more than one source.
On the other hand, Week 36 saw some movement in the variety department, with the likes of Ventura, Sekoya pop, and Magica (EB-92) going up, while others, like Biloxi, Emerald, and Rosita suffered from a slight decline.
Related stories
Zimbabwe beats South African in securing zero-tariff access for blueberries to China
Netflix VS The blueberry market… Where to find the best entertainment?


Subscribe to our newsletter