


Agronometrics in Charts: The "green gold" craze during Super Bowl in U.S.


In this installment of the ‘Agronometrics In Charts’ series, Cristian Crespo illustrates how the U.S. market is evolving. Each week the series looks at a different horticultural commodity, focusing on a specific origin or topic visualizing the market factors that are driving change.


Super Bowl N°55 will be played on Sunday, February 7. This unique-to-America sporting event is the most-watched in the world in a single day, surpassing even the FIFA World Cup final.
This football game, which is treated as a rightful holiday in the U.S., takes place on the first Sunday of every February.
During this time of year, the avocado market also has its own championship as the “Green Gold” market behaves in a remarkable way; with its most popular consumption in the form of guacamole.
The graph below shows the historical volume of avocados from November to March, the time when avocado imports to the U.S., principally from Mexico, increase to meet the demand during the days leading up to the Super Bowl. The peak comes during January every year.
It should be noted that the volumes of avocados from Mexico have been the highest in recent seasons for the same date.
Historical volume of Mexican avocados in the U.S. market (kg)

(Source: USDA Market News via Agronometrics) [Agronometrics users can view this chart with live updates here]
In relation to the prices of avocados in the North American market, we can see from the graph below that this season has seen lower prices at US$1.92 than those of previous years. This reports a 22% decrease year-on-year most likely due to the high volumes coming from Mexico this season.
Historical prices of Mexican avocados in the U.S. market (USD/kg)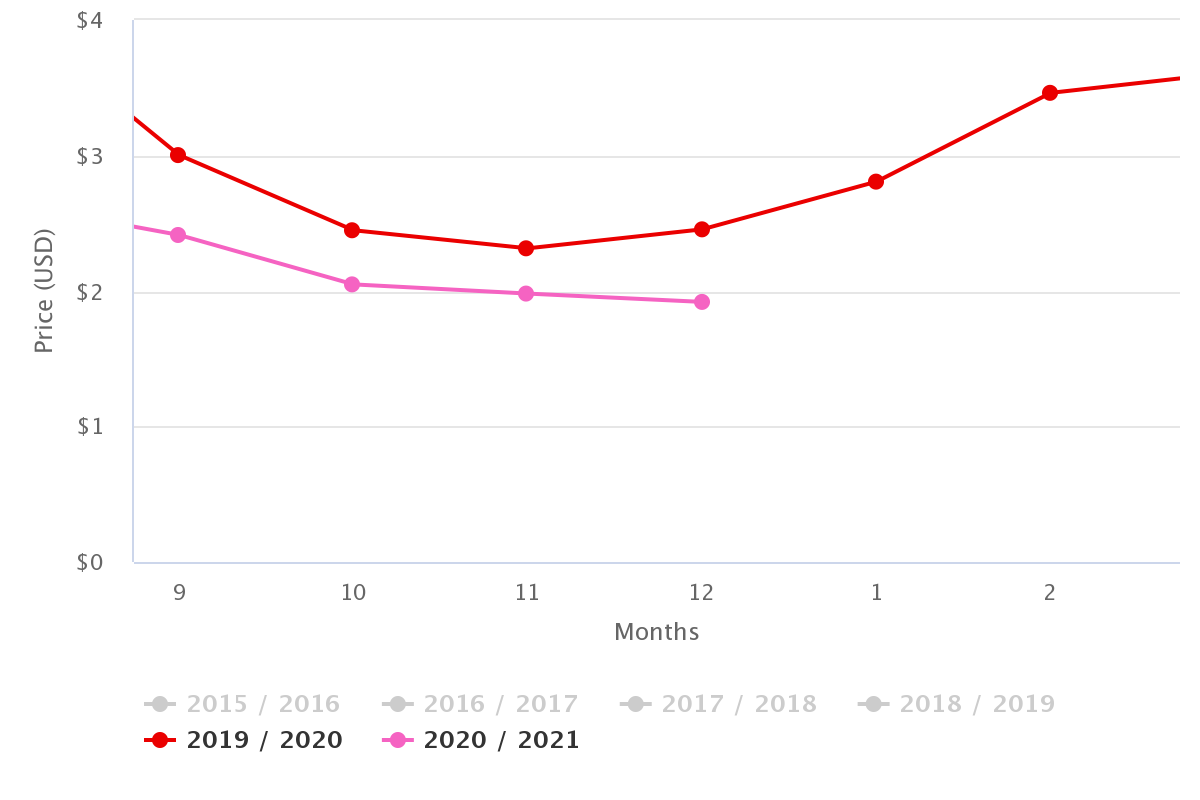
(Source: USDA Market News via Agronometrics) [Agronometrics users can view this chart with live updates here]
In our ‘In Charts’ series, we work to tell some of the stories that are moving the industry. Feel free to take a look at the other articles by clicking here.
You can keep track of the markets daily through Agronometrics, a data visualization tool built to help the industry make sense of the huge amounts of data that professionals need to access to make informed decisions. If you found the information and the charts from this article useful, feel free to visit us at www.agronometrics.com where you can easily access these same graphs, or explore the other 20 fruits we currently track.


Subscribe to our newsletter


