


Economic cost of major foodborne illnesses in U.S. increased $2B from 2013 to 2018


By Sandra Hoffmann and Jae-Wan Ahn of the USDA


Foodborne illnesses from different pathogens (bacteria, viruses, and parasites) cause a variety of health effects, ranging from a few days of diarrhea to more serious outcomes such as kidney failure, cognitive impairment, and even death. Since the mid-1990s, the USDA, Economic Research Service (ERS) has estimated the economic cost of 15 major foodborne illnesses.
Monetary measures of these health effects provide a common metric to compare impacts of various pathogens, a way to aggregate impacts across illnesses, and a means of comparing the costs of experiencing those illnesses with the costs of preventing them. Government agencies and private industries rely on cost estimates for foodborne illness as they set priorities, make policies, and develop management initiatives. They also use the ERS estimates to help the public understand the importance of preventing foodborne disease.
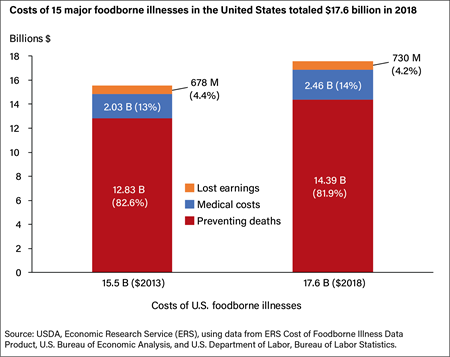
ERS last estimated the total cost of the leading U.S. foodborne illnesses at $15.5 billion in 2013 dollars. While overall inflation in the United States has been low in recent years, inflation in the healthcare sector has not been low. ERS recently released revised cost estimates for these illnesses showing inflation and income growth alone increased the economic cost of these pathogens by $2 billion, to $17.6 billion in 2018 dollars, holding the number of cases constant.
Inflation in Hospitalization Costs Drove Increases in Medical Care Costs
To determine the economic cost of foodborne illness, ERS looked at the costs of medical care, the value of lost earnings, and a monetary measure of death linked to how much people are willing to pay to reduce the risk of dying from foodborne illness (see blue box below). ERS used the Centers for Disease Control and Prevention’s (CDC) foodborne illness incidence rates from 2011—the agency’s most recent data—to develop the economic cost estimates.
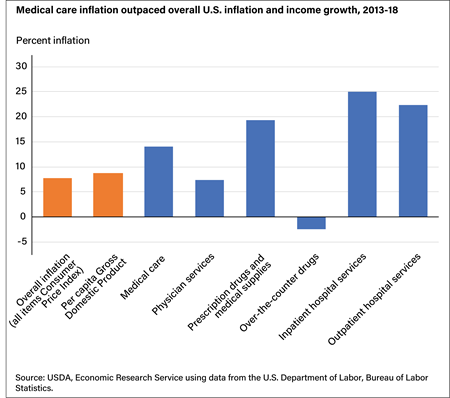
From 2013 to 2018, inflation for the entire U.S. economy was 7.8 percent. During this period, income growth, measured in terms of real per capita Gross Domestic Product (GDP), was 8.8 percent. At the same time, inpatient hospital costs rose 25 percent, outpatient hospital costs grew 22.5 percent, and costs of prescription drugs and medical supplies increased 19.3 percent.
The cost of inpatient hospital services accounted for 74 percent of the inflation of medical care costs for foodborne illness between 2013 and 2018, ERS researchers found. The cost of medical care as whole care accounted for only 21 percent of inflation in the total cost of foodborne illnesses.
Value of Preventing Death Accounted for Most Inflation for Foodborne Illness Costs
The 15 foodborne pathogens in ERS’s cost-of-illness estimates accounted for more than 95 percent of the cases, hospitalizations, and deaths from foodborne illnesses for which the CDC can determine a specific pathogen cause. The CDC estimated the 15 major foodborne pathogens cause roughly 8.9 million cases of illness and 54,000 hospitalizations each year. ERS estimated these pathogens and their chronic health outcomes led to nearly 1,480 deaths each year. This estimate of deaths reflects the CDC estimated number of deaths from acute illnesses plus ERS estimation of deaths from chronic health outcomes from these acute illnesses.
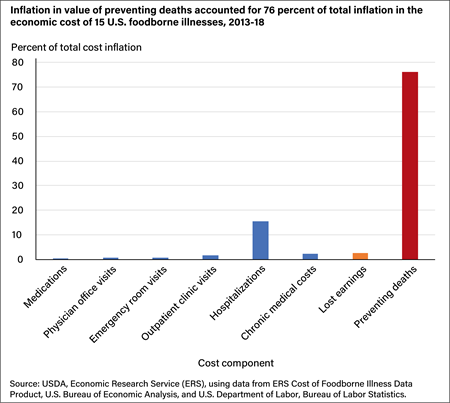
Economists usually measure the value of preventing death in terms of people’s willingness to pay for reduced risk of death, a measure of demand for reduction in mortality risk. Based on a meta-analysis of previous studies, ERS approximated the value of each life saved in the United States at $8.7 million in 2013 dollars, which increased to $9.7 million in 2018 dollars when adjusted for inflation and income growth. Based on the ERS estimate of 1,480 deaths in 2018, the total value of preventing deaths from the major foodborne pathogens was $14.4 billion in 2018 dollars, a 12-percent increase from $12.8 billion in 2013 dollars.
This $1.6 billion increase was 76 percent of the $2 billion inflation in the total cost of these foodborne illnesses between 2013 and 2018. So, even though the mortality risk from foodborne disease was relatively low and the increase in the value of preventing deaths was lower than inflation in healthcare costs, the high-value people place on reducing deaths made it the largest component of the costs of these 15 foodborne illnesses.
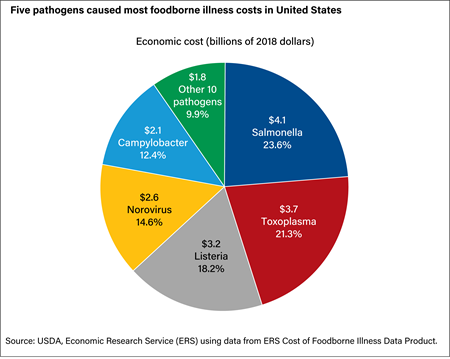
Most of the Economic Cost of Foodborne Illnesses Was Caused by a Handful of Pathogens
The number of cases of illness and their health outcomes varied across the different bacteria, viruses, and parasites that cause foodborne illnesses. ERS researchers found this led to significant variation in the change in costs of the 15 foodborne illnesses from 2013 to 2018, ranging from a $270,095 change for Cyclospora to a $475,579,129 change for Salmonella.
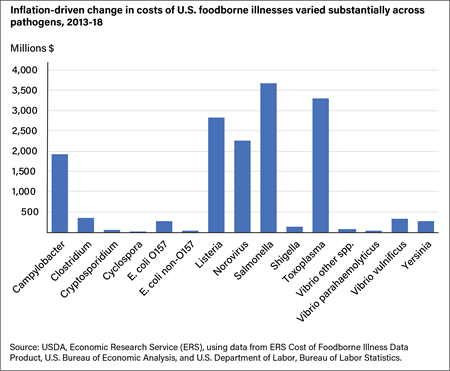
Five of the pathogens accounted for about 90 percent of the total costs from these foodborne pathogens ($15.7 billion in 2018 dollars). Three pathogens, Salmonella, Toxoplasma, and Listeria, were responsible for more than 60 percent of the total economic cost from major foodborne illnesses in 2018 dollars.
This article was originally published on USDA's Economic Research Service's website


Subscribe to our newsletter


