


Agronometrics in Charts: Peach volumes from California set to fall by up to 20 percent


In this installment of the ‘Agronometrics In Charts’ series, Sarah Ilyas studies the state of the California peach market. Each week the series looks at a different horticultural commodity, focusing on a specific origin or topic visualizing the market factors that are driving change.


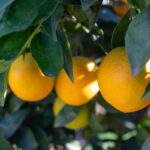
California is the leading producer of the USA’s clingstone and freestone peach varieties. Although some peaches are considered semi-freestone, most peach varieties can generally be classified into one of two categories: freestone or clingstone.
Freestone peaches are more commonly available and have pits that can be easily removed, whereas the pit of clingstones is enmeshed within the flesh. Freestone and clingstone peaches, both have numerous varieties that have distinctive flesh color, skin color, firmness and succulence. Two of the most popular varieties of yellow fleshed freestone peaches are Elegant Lady and OHenry. California clingstone peaches are harvested from mid-July to mid-September, while the California freestone varieties are harvested from April through October.
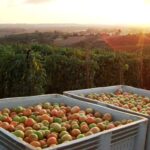
Owing to its balmy, Mediterranean climate and fertile soil, the Central Valley is a prime location for the growth of peaches. Peaches that are directed for the fresh market, sold in the grocery store or farmer’s market, are grown mainly in Madera, Fresno and Tulare counties. Processing peaches are found in the Yuba City region, southern San Joaquin County, Stanislaus County,
Merced County and the Kingsburg area of Fresno County. Jon McClarty of HMC Farms in Kingsburg said in an industry publication that they are coming off a big crop last year, so the industry was going to be done a bit in volume, plus there have been some frost and hail so it will also bring down volume a bit more. He believes the industry is going to be down 15-20 percent compared to last year.. This season, a total of 907 K tonnes of peaches was recorded, a 63 percent drop compared to the previous season.

(Source: USDA Market News via Agronometrics. Agronometrics users can view this chart with live updates here)
Much of the industry's costs are from labor, which has taken a jump up as have materials, and they must try to price at a level so that again in 2023 pricing will be strong, McClarty added.
Recently, the California stone fruit industry has been battling with exorbitant costs; a 15 percent increase in costs per year was recorded in the last three years, resulting in a 45 percent rise in overall costs. Shipping costs have surged by 100 percent over the last two years, packaging is up by 20 percent and sea freight is up 50 percent.
Ian LeMay, president at California Fresh Fruit Association told an industry publication that the stone fruit industry must understand that farming is in jeopardy and that it is time to build a plan for financial sustainability and longevity. The industry needs the support of partners in the retail space.
Prices in the last season ranged from $22.23 per package in week 21 to $16.74 per package in week 30. Owing to the smaller volumes expected this season, prices are expected to be higher.

(Source: USDA Market News via Agronometrics. Agronometrics users can view this chart with live updates here)
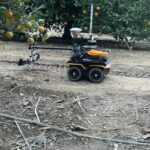
California is commonly touted as the stone fruit state. The industry is incorporating newer practices and methodologies aimed at finding efficient ways to drive down costs in operations without impacting safety and quality.
In our ‘In Charts’ series, we work to tell some of the stories that are moving the industry. Feel free to take a look at the other articles by clicking here.
All pricing for domestic US produce represents the spot market at Shipping Point (i.e. packing house/climate controlled warehouse, etc.). For imported fruit, the pricing data represents the spot market at Port of Entry.
You can keep track of the markets daily through Agronometrics, a data visualization tool built to help the industry make sense of the huge amounts of data that professionals need to access to make informed decisions. If you found the information and the charts from this article useful, feel free to visit us at www.agronometrics.com where you can easily access these same graphs, or explore the other 21 commodities we currently track.


Subscribe to our newsletter


