


Agronometrics in Charts: Avocado hectarage growth set to slow in Peru


In this installment of the ‘Agronometrics In Charts’ series, Sarah Ilyas studies the state of the Peruvian avocado industry. Each week the series looks at a different horticultural commodity, focusing on a specific origin or topic visualizing the market factors that are driving change.


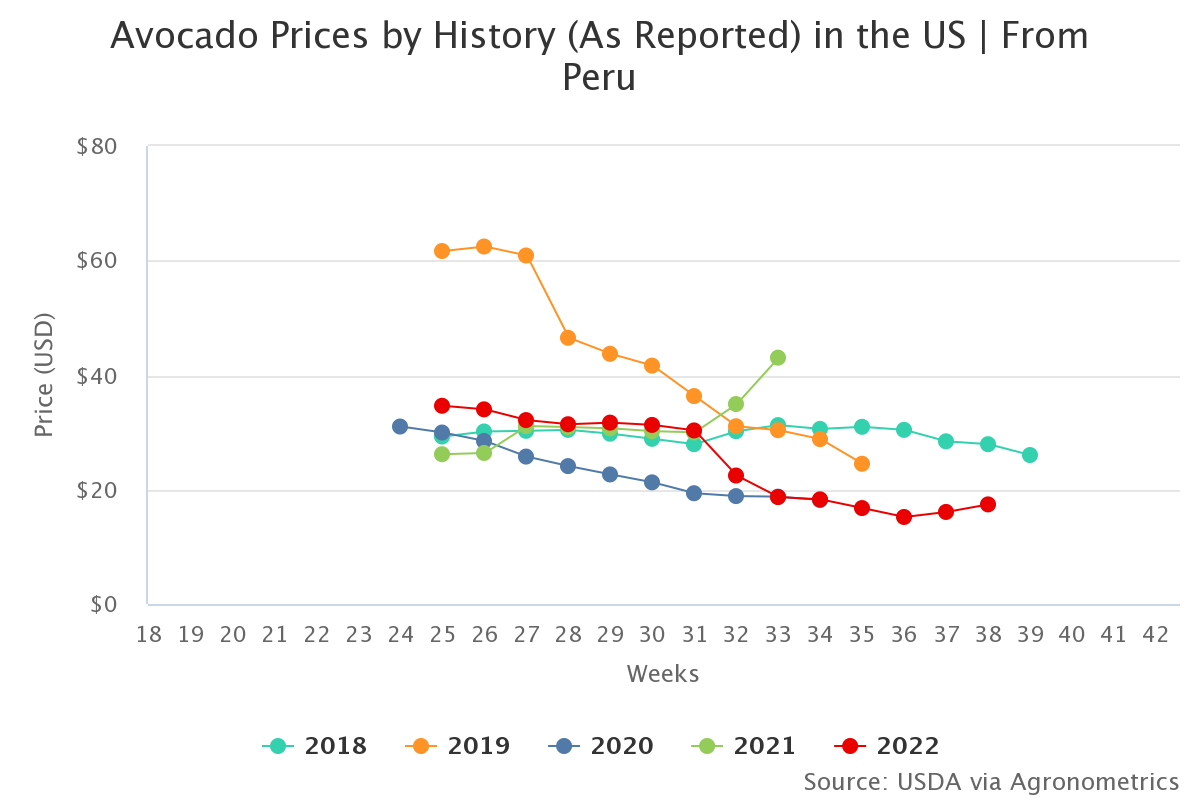
The Peruvian avocado season recently concluded following a record drop in prices. Higher volumes of fruit arriving from other origins and logistical impediments were the primary culprits behind the decline. Spikes in freight rates and cancellation of routes led to delays in shipments, causing multiple shipments to be unloaded together at destination ports.
According to the Peruvian Association of Hass Avocado Producers (ProHass), almost 10,000 young hectares of Hass avocado will enter production in the 2022-23 season, adding to the more mature growing areas. However, the country will be making almost no additional plantings for growing. The development comes after changes in the agrarian promotion law and the elimination of tax incentives, according to the Peruvian newspaper, Gestion.
Peru exported 613,947 tons of avocado for 976 million dollars between January and September 2022, the period of time in which the country makes 99% of its shipments, according to Fresh Fruit. The export volume increased by 11% but its value decreased by 10%, as the average price achieved in this campaign stood at 1.59 dollars per kilogram, one of the lowest prices in recent years.
The Peruvian nuevo sol has weakened against the US dollar considerably and producers are likely to be impacted more severely by the slump in prices now, in comparison to 2-3 years ago when the currency was on solid footing.
According to forecasts, by the end of 2022, there will be nearly 43,000 hectares devoted to this crop. Regions that have stood out the most in production are La Libertad, Lambayeque, and Lima with 34, 20, and 15 percent of the participation, respectively. According to Juan Carlos Paredes Rosales, president of ProHass, avocado plant orders for nurseries have been minimal this year.
“There are only 1 or 2 large avocado projects this year. There are no others," he said. Previously, between 4,000 and 5,000 hectares of avocado were planted yearly for production. This has led many Peruvian and international producers to choose to invest in other countries such as Colombia and Ecuador.
 Source: USDA Market News via Agronometrics. (Agronometrics users can view this chart with live updates here)
 Source: USDA Market News via Agronometrics. (Agronometrics users can view this chart with live updates here)

The US continues to be one of the markets that pay premium prices for Peruvian avocados (1.90 per kilogram). Peruvian avocado shipments to the U.S. market have risen by about 30% year-on-year so far during 2022 owing to a drop in production in Mexico's key states.
Additionally, avocado production in California, which usually accounts for 10% of American consumption, has been affected by severe droughts and heat waves. While Peru has managed to capitalize on this opportunity, spikes in inflation have altered consumer demand and have led customers to prioritize purchasing essential goods and convenient products over exotic products such as avocados. However, Peruvian shipments have managed to thrive in markets by increasing both their volume and their value.
 Source: USDA Market News via Agronometrics. (Agronometrics users can view this chart with live updates here)

In our ‘In Charts’ series, we work to tell some of the stories that are moving the industry. Feel free to take a look at the other articles by clicking here.
All pricing for domestic US produce represents the spot market at Shipping Point (i.e. packing house/climate controlled warehouse, etc.). For imported fruit, the pricing data represents the spot market at Port of Entry.
You can keep track of the markets daily through Agronometrics, a data visualization tool built to help the industry make sense of the huge amounts of data that professionals need to access to make informed decisions. If you found the information and the charts from this article useful, feel free to visit us at www.agronometrics.com where you can easily access these same graphs, or explore the other 21 commodities we currently track.


Subscribe to our newsletter


