


Agronometrics in Charts: Volumes of Peruvian mangoes expected to increase by up to 25% in the 2022-23 season


In this installment of the ‘Agronometrics In Charts’ series, Sarah Ilyas studies the state of the
Peruvian mango season. Each week the series looks at a different horticultural commodity, focusing on a specific origin or topic visualizing the market factors that are driving change.


Peru is the fourth largest exporter of mangoes in the world, especially of the Haden, Tommy Atkins, Kent (fresh) and Edward (frozen) types. The season begins in Piura, the country's main producing region. The season kicked off in Week 46 and is expected to last until Week 12 of 2023.
Lengthy transit times in the 2021/22 season led to the fruit arriving at destination ports in sub-par condition. For the upcoming 2022-2023 season, logistics operators are offering shipments with shorter transit times of between 28 to 33 days to the US. Despite the late start, mango shippers are expecting a strong season. “This is by far the best Peruvian fruit I have seen in years. This year Peru has very beautiful fruit to offer which is excellent news,” says Daniel Ibarra, owner of Splendid by Porvenir.

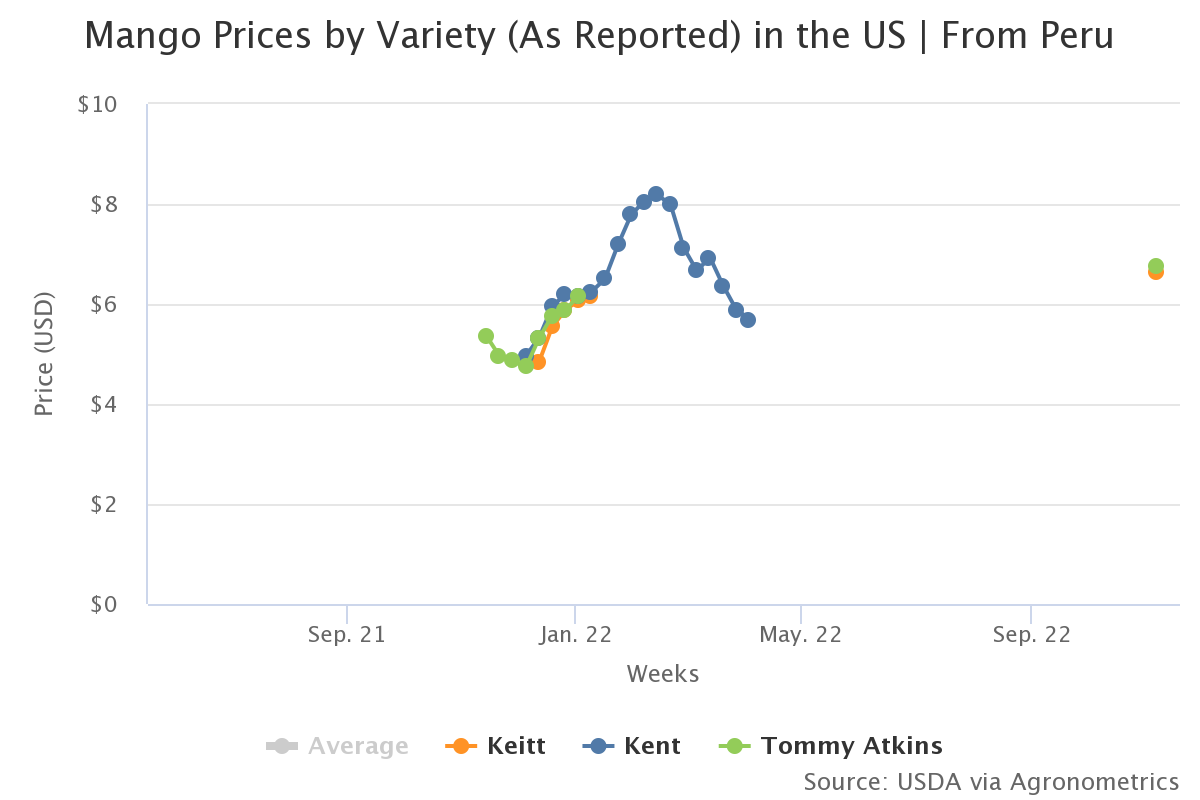
Source: USDA Market News via Agronometrics. (Agronometrics users can view this chart with live updates here)
A 20-25 percent increase in volumes is expected this season. An increase complemented by the Mango Boards projections which expect an 18% increase year over year. Owing to the higher volumes, shipments to the US are expected to kick off earlier than usual, around the first week of December. Peruvian exporters, however, continue to battle with high freight prices and a lack of containers which, as recently warned by the Peruvian Association of Producers and Exporters of Mango (APEM), continues to be a concern for the new campaign.
“The shipping cost went from 40% to 80% of the cost of packaging and shipping. This caused the result of the business to be negative and, in some cases, the bankruptcy of companies that could not afford the costs,” the union recalls, referring to the 2021/22 campaign.
Demand for larger-sized fruits such as 6s,7s,8s and 9s is strong while that for smaller fruits such as 10s and 12s is relatively low. Steady movement is expected throughout December and into January. Initial shipments will be of the Kent variety, which is preferred by consumers owing to its superior taste and size.
 Source: USDA Market News via Agronometrics. (Agronometrics users can view this chart with live updates here)
 Source: USDA Market News via Agronometrics. (Agronometrics users can view this chart with live updates here)
According to the Ministry of Agrarian Development and Irrigation (Midagri), mangoes are identified as one of the main export fruits of Peru and are recognized in international markets for their premium quality. In the case of the United States, one of the main destination markets, the mangoes go through a hydrothermal treatment to ensure that they are free of fruit fly larvae, a pest considered as a quarantine pest by the Sanitary Surveillance Service (APHIS).
 Source: USDA Market News via Agronometrics. (Agronometrics users can view this chart with live updates here)
In our ‘In Charts’ series, we work to tell some of the stories that are moving the industry. Feel free to take a look at the other articles by clicking here.
All pricing for domestic US produce represents the spot market at Shipping Point (i.e. packing house/climate controlled warehouse, etc.). For imported fruit, the pricing data represents the spot market at Port of Entry.
You can keep track of the markets daily through Agronometrics, a data visualization tool built to help the industry make sense of the huge amounts of data that professionals need to access to make informed decisions. If you found the information and the charts from this article useful, feel free to visit us at www.agronometrics.com where you can easily access these same graphs, or explore the other 21 commodities we currently track.


Subscribe to our newsletter


