



US grocery inflation reaccelerates in October as consumer goods prices rise by 2.7 percent

 Add Fresh Fruit Portal to Google
Inflation across everyday consumer products picked up speed in October, according to the latest figures from Numerator’s Consumer Goods Price Index (CGPI).
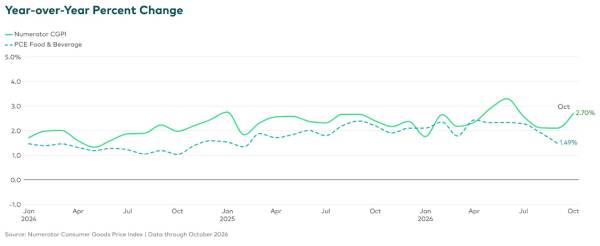
The data shows prices paid by US shoppers rose by 2.7 percent year-over-year, up from 2.1 percent in September.
Month over month, everyday household goods climbed 0.6 percent in October after a 0.7 percent uptick in September. According to the report, these consecutive monthly increases follow brief price declines in July and August, underscoring ongoing price volatility for essential grocery baskets.
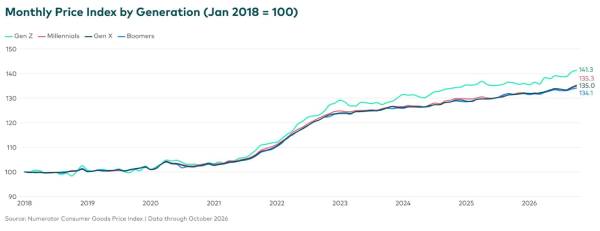
Cumulative inflation has now driven everyday product prices up nearly 35 percent since January 2018.
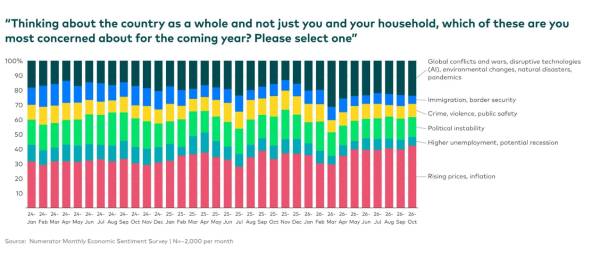
The persistent upward pressure is weighing heavily on consumer sentiment. In Numerator’s October Economic Sentiment Tracker, a record 42 percent of surveyed shoppers named rising prices their top concern for the coming year, up from the prior peak of 40 percent in August.
“After two months of declining prices this summer, inflation for everyday goods has accelerated again, and consumers are increasingly concerned about what comes next,” said Paul Stanley, Numerator's Senior Economist.
CGPI measures retail inflation using verified household transaction data across grocery, household items, and health and beauty, tracking real-world prices paid after coupons, promotions, and loyalty discounts.
Inflation is unequally distributed
Price pressures varied sharply across demographic segments.
Gen Z consumers saw prices jump 3.8 percent year over year in October, well above the 2.7 percent national average. Additionally, the generational cohort has weathered a 41.3 percent cumulative surge since 2018, more than any other.
Low-income shoppers have experienced a nearly 37 percent cumulative rise over the same period.
“[These groups] are experiencing higher inflation in part because they spend more on quick-service restaurants than the average consumer. Quick-service restaurant prices have increased 55.4 percent since January 2018,” explains the Numerator report.
Regionally, cumulative inflation remained lowest in the Northeast at nearly 34 percent, while the Midwest and West have consistently outpaced the South and Northeast in annual inflation rates since the summer.
Calculated from approximately 7 million monthly item-level transactions from a representative US panel, the CGPI uses base- and current-period quantity weights similar to the Bureau of Economic Analysis' PCE Price Index. It dynamically reflects real-time consumer adjustments such as brand switching, product downsizing, and shifts between retail channels.
*Main image is referential via Shutterstock | All graphs courtesy of Numerator
Related stories
Inflation squeezes the produce aisle: 33 percent of US shoppers cut back on fruits and veggies
US fresh fruit prices outpace grocery inflation as supply tightens