Lemons in Charts: Massive import growth in tandem with rising prices

In this 'In Charts' series of mini-articles, Colin Fain of data visualization tool Agronometrics illustrates how the U.S. market is evolving. In each series, he will look at a different fruit commodity, focusing on a different origin or topic in each installment to see what factors are driving change.
This article comes as a modification to the previous Lemons in Charts article published on July 31, in light of new information. After a reader commented on that article, I consulted directly with the USDA and learned that information on domestic lemon volumes is at present limited to U.S. shipments made by rail, as there is not yet a method in place to collect data on the country's total shipments.
Now knowing that the data is limited, I thought it would be worthwhile to modify the focus of the article to concentrate on imports, which have seen an impressive level of growth, especially from Chile and Mexico which alone represented 93% of all imports in 2017.
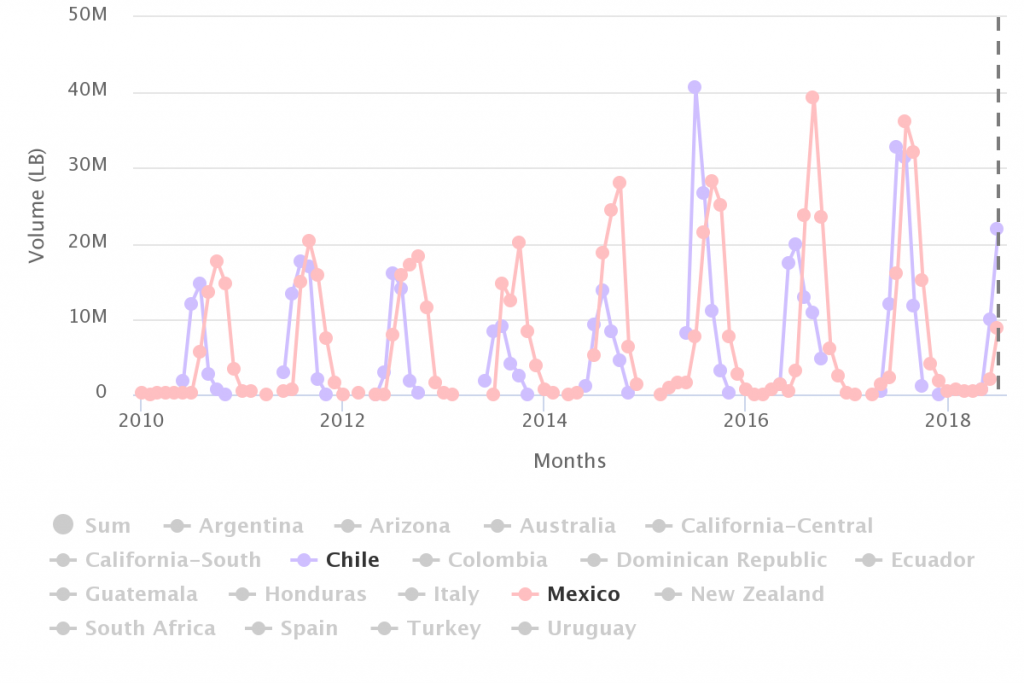
The graph below demonstrates the rate of growth that lemons from the two origins have been seeing. When compared to 2010, volumes saw an impressive rate of 130%, more than doubling in the last eight years.
Lemon Movements from Chile and Mexico
(Source: USDA Market News via Agronometrics)
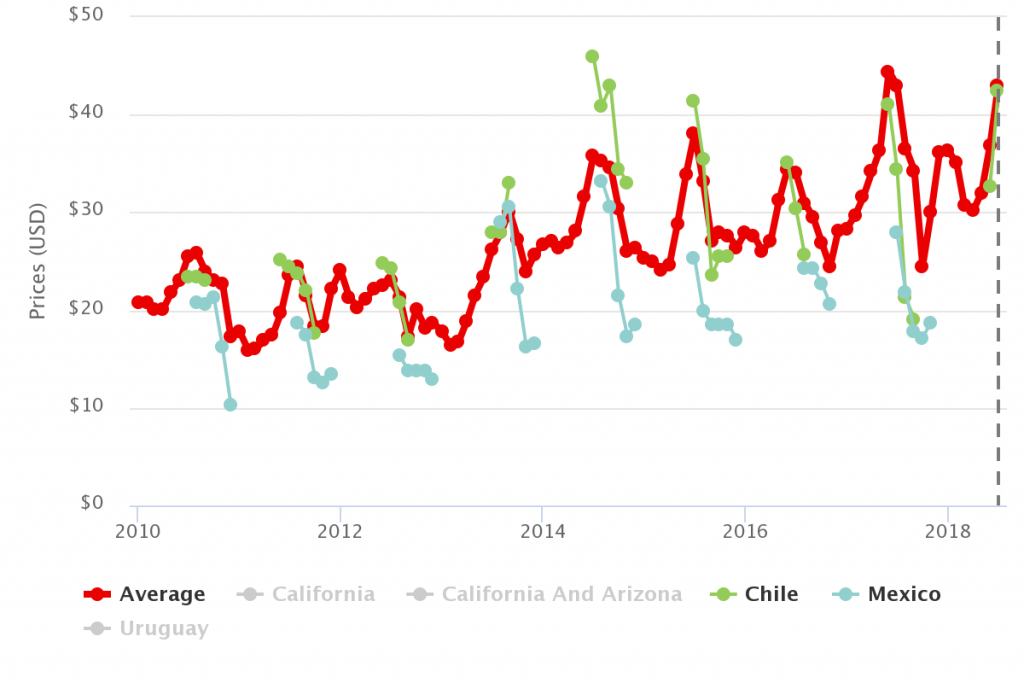
Looking at growth on this scale begs the question how did the prices react? Surprisingly, it looks like U.S. consumers can’t get enough of this yellow citrus. Where in 2010 the average yearly price hovered right around US$22.00, in 2017 the average was close to US$35.00.
Right at the beginning of the summer, Chile does particularly well, bringing an essential ingredient for drinks to help quench the summer heat. Correspondingly, Chile has seen the most amount of growth, increasing by 180% since 2010 and slowly looking to take on Mexico as the leading supplier. In 2010 Chile sent only 57% of Mexico’s volume, while last year they sent 82%.
Lemons Shipping Point Prices, 7/10 Bushel Cartons, in USD
(Source: USDA Market News via Agronometrics)
As the highest prices over the last three years have been in June and July, when Chile is most prevalent, I would expect that we can continue to see more growth from the Southern Hemisphere. Argentina, which has just recently been given permission to enter the market, may also play a big roll in the future. So far this year they have sent volumes in late May and early June - a great space that they can capitalize on as they increase their exports.
Lemons Shipping Point Prices, 7/10 Bushel Cartons, in USD, by Month, Comparing the Last Four Years
(Source: USDA Market News via Agronometrics)
In our 'In Charts' series, we work to tell some of the stories that are moving the industry. Feel free to take a look at the other articles by clicking here.
Agronometrics is a data visualization tool built to help the industry make sense of the huge amounts of data that you depend on. We strive to help farmers, shippers, buyers, sellers, movers and shakers get an objective point of view on the markets to help them make informed strategic decisions. If you found the information and the charts from this article useful, feel free to visit us at www.agronometrics.com where you can easily recreate these same graphs, or explore the other 20 fruits we currently track, creating your own reports automatically updated with the latest data daily.
To welcome Lemon professionals to the service we want to offer a 5% discount off your first month with the following coupon code: LEMONS1
The code will only be good until August 21, so visit us today.


