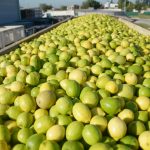
Lemons in Charts: Massive U.S. category growth in tandem with rising prices

Correction: The volumes for U.S. production are incomplete. The volumes for California and Arizona that are available represent only movements shipped by rail. The USDA says it is working on offering a more complete dataset and hopes provide it in the near future.
In this 'in charts' series of mini-articles, Colin Fain of data visualization tool Agronometrics illustrates how the U.S. market is evolving. In each series, he will look at a different fruit commodity, focusing on a different origin or topic in each installment to see what factors are driving change.
Of the 23 commodities we track in Agronometrics, lemons have seen the second-highest percentage growth, sending 80% more fruit in 2017 than in 2010.
By this measure, lemons outgrew all the berries, avocados, kiwis, cherries and the list goes on, the only other commodity that grew more, as a percentage of 2010, were guavas, which only offered U.S. consumers 24 million pounds in 2017, about 10% of the volume moved the same year by lemons.
Lemon movements in pounds

(Source: USDA Market News via Agronometrics)
When you look at growth on the scale that we are seeing with lemons, the first question that should come up is how did the prices react? Surprisingly, it looks like U.S. consumers can’t get enough of this yellow citrus. Where in 2010 the average yearly price hovered right around US$22.00, in 2017 the average was close to US$35.00.
Lemon shipping point prices, 7/10 bushel cartons, in USD

(Source: USDA Market News via Agronometrics)
The seasonality of the industry is well-defined, consistently demanding more fruit in the summer and fall which is mostly supplied by Chile and Mexico.
U.S. lemon monthly movements in pounds - comparing the last four years

(Source: USDA Market News via Agronometrics)
Correspondingly, the largest supplier to the U.S. market is Mexico, which in 2017 supplied 45% of the market. However, the greatest growth with 180% since 2010 has come from Chile, who came in a close second with 37% of the market.
US lemon movements in pounds, 2017 - comparing origins

(Source: USDA Market News via Agronometrics)
As prices over the last three years have been highest in June and July - when Chile is most prevalent - I would expect that we can continue to see more growth from the Southern Hemisphere. Argentina, which has just recently been given permission to enter the market, may play a big roll in the future. So far this year they have sent volumes right in late May and early June - a great space that they can capitalize on in seasons to come.
Lemon monthly shipping point prices, 7/10 bushel cartons, in USD - comparing the last four years

(Source: USDA Market News via Agronometrics)
In our 'in charts' series, we work to tell some of the stories that are moving the industry. Feel free to take a look a some of the other articles listed below.
Avocados:
Avocados in Charts: Dynamic growth and opportunities in the U.S. market
Avocados in Charts: California at the heart of the US market
Avocados in Charts: Peru – An opening window of opportunity
Blackberries:
Blackberries in Charts: Strategic growth leads to more stable pricing
Blackberries in Charts: Planesa on Guatemala's Volcanic eruption and upcoming season
Blueberries:
Blueberries in Charts: Finding opportunities in the gaps
Strawberries:
Strawberries in Charts: The king of berries sees its biggest month ever
Mangoes:
Mangoes in Charts: Record prices in June may remain high for coming months
Agronometrics is a data visualization tool built to help the industry make sense of the huge amounts of data that you depend on. We strive to help farmers, shippers, buyers, sellers, movers and shakers get an objective point of view on the markets to help them make informed strategic decisions. If you found the information and the charts from this article useful, feel free to visit us at www.agronometrics.com where you can easily recreate these same graphs, or explore the other 20 fruits we currently track, creating your own reports automatically updated with the latest data daily.
To welcome Lemon professionals to the service we want to offer a 5% discount off your first month with the following coupon code: LEMONS1
The code will only be good till the 21st of August, so visit us today.


