


Agronometrics in Charts: Apple market sees high pricing in 2021


In this installment of the ‘Agronometrics In Charts’ series, Cristian Crespo F. illustrates how the U.S. market is evolving. Each week the series looks at a different horticultural commodity, focusing on a specific origin or topic visualizing the market factors that are driving change.


Apples in the U.S. market are seeing high prices which started October 2020 and have continued to July 2021. This may be due to a decrease in harvests in areas that export to the North American market, created primarily by climatic problems.
Among the origins that recorded lower export volumes are Washington, Chile, Michigan, Appalachia and New Zealand.
As can be seen in the graph below, in July of this year the average prices of apples in the U.S. market were US$1.63 per kilogram, a 22 percent increase year on year.
Prices of apples in the U.S. market (USD/KG)
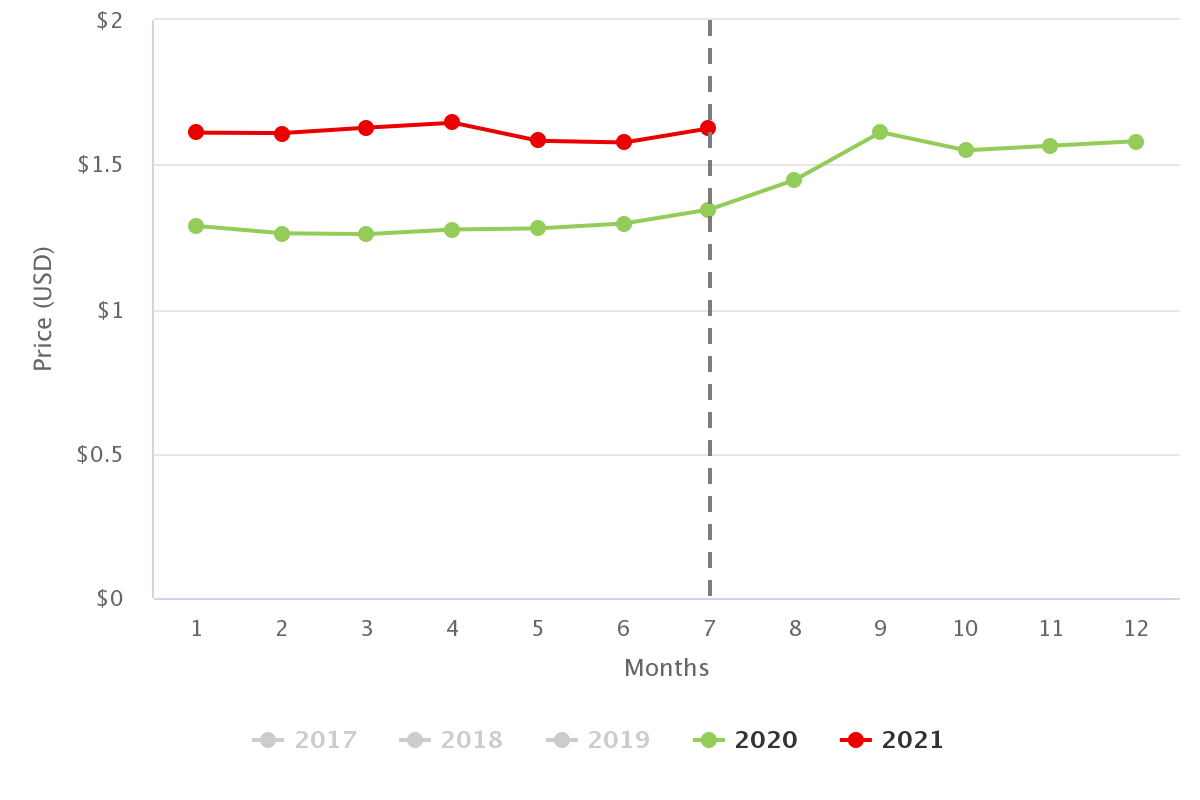
(Source: USDA Market News via Agronometrics) [Agronometrics users can view this chart with live updates here]
Regarding apple volumes in the North American market, between January to July of this year, volumes reached over 1.6 million metric tons (MT), an 11.4 percent decrease year on year as is shown by the graph below.
Apple volumes in the U.S. market (KG)

(Source: USDA Market News via Agronometrics) [Agronometrics users can view this chart with live updates here]
Much of the difference in volumes year on year come from Washington, which saw a 10.7 percent decrease year on year and came to a bit below 1.4 million MT.
We will have to wait and see what happens to market prices as they have been quite stable for the last 20 years, but are still sensitive to significant volume variations. We also have to see how Washington fares after the heat wave that has hit several producing areas in North America.
In our ‘In Charts’ series, we work to tell some of the stories that are moving the industry. Feel free to take a look at the other articles by clicking here.
You can keep track of the markets daily through Agronometrics, a data visualization tool built to help the industry make sense of the huge amounts of data that professionals need to access to make informed decisions. If you found the information and the charts from this article useful, feel free to visit us at www.agronometrics.com where you can easily access these same graphs, or explore the other 20 fruits we currently track.


Subscribe to our newsletter


