


Agronometrics in Charts: Blackberry prices soar above previous years


In this installment of the ‘In Charts' series, Cristian Crespo of Agronometrics illustrates how the U.S. market is evolving. Each week the series looks at a different horticultural commodity, focusing on a specific origin or topic visualizing the market factors that are driving change.


This week we will look at the blackberry market in the U.S. and see how prices have behaved during 2021, specifically the prices and volumes of the fruit from Mexico who is the main supplier of the fruit to the North American market now that California's season just ended.
In past articles, we talked about the fact that blackberry prices were in free fall, which happened between weeks 30 and 34 of this year. As shown in the graph below, from week 35 a gradual increase began until week 38, then fell again in week 39 and continued its climb until week 44.
We can see in the following graph that the average prices of conventional blackberries in the U.S. market in week 44 were around $US 7.64 per kilogram, a 33 percent increase year on year. Prices of blackberries from Mexico and other Central American countries are currently being recorded.
Blackberry prices in the U.S. market (USD/KG)
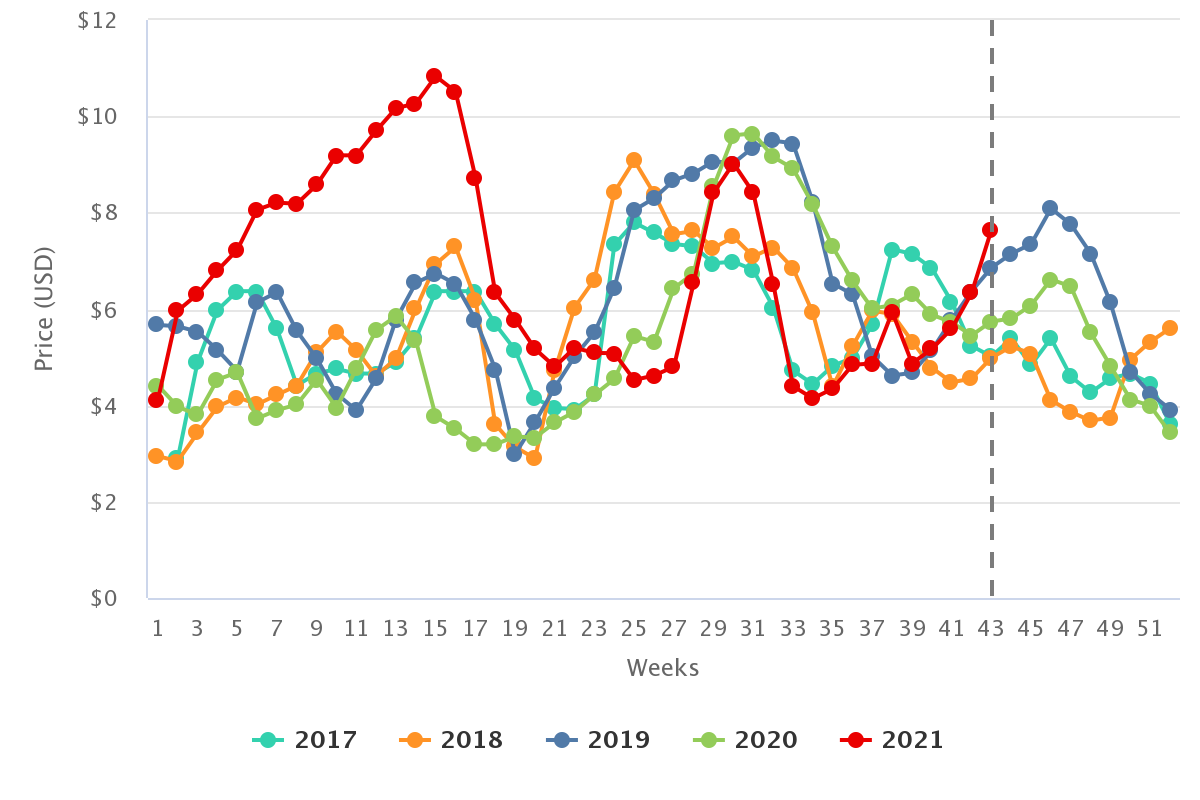
(Source: USDA Market News via Agronometrics) [Agronometrics users can view this chart with live updates here]
This increase in blackberry prices may be due to the decrease in volume coming from Mexico in comparison to last year, even though California volumes were higher and can be seen in the two graphs below.
Volume of blackberries from Mexico in the U.S. market (KG)
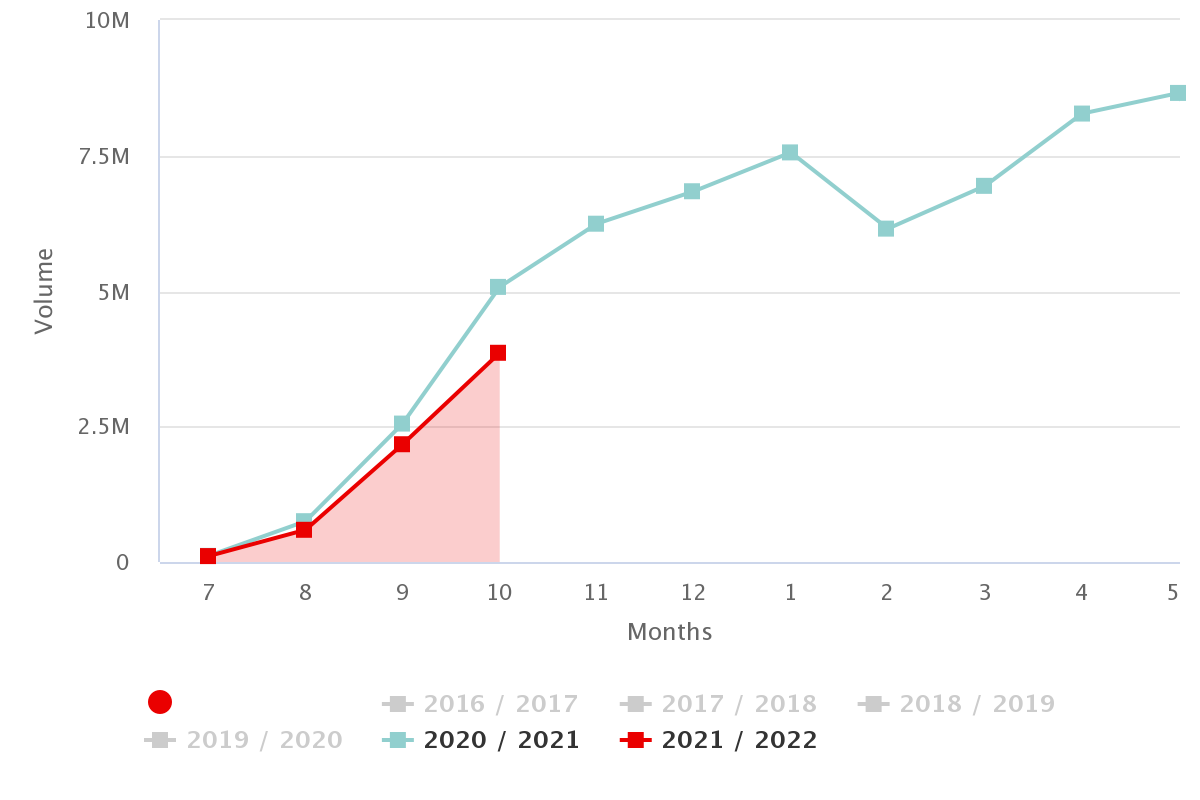
(Source: USDA Market News via Agronometrics) [Agronometrics users can view this chart with live updates here]
Volume of California blackberries in the U.S. market (KG)

(Source: USDA Market News via Agronometrics) [Agronometrics users can view this chart with live updates here]
This is happening at a time when the blackberry season in Central California is ending, and the season with the highest volume from Mexico begins. We will have to see what happens with Mexico's production, the climatic factors and the impact of volumes on future prices.
Finally, we want to show you, using a new tool on the www.agronometrics.com platform, that blackberries from Mexico are transported to the U.S. market almost entirely by truck, and to a very small extent by plane.
Historical volumes of blackberries from Mexico in the U.S. market, by mode of transport (KG)
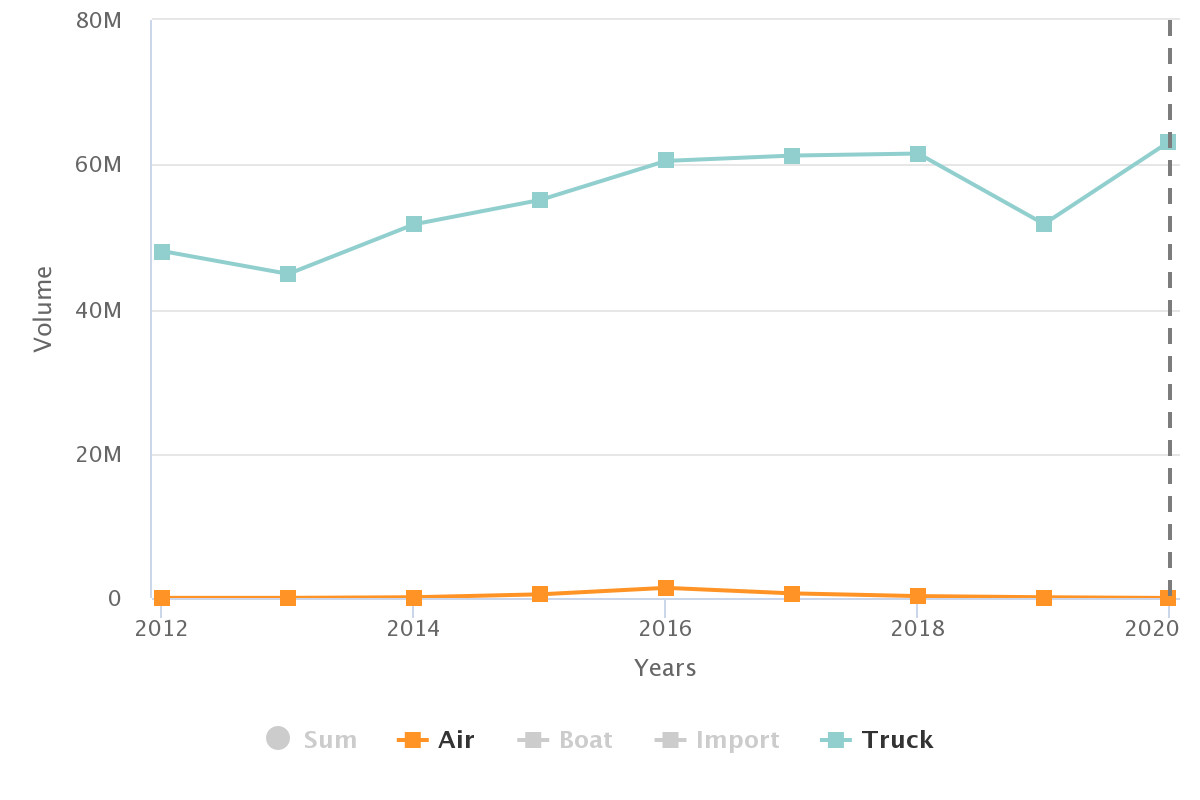
(Source: USDA Market News via Agronometrics) [Agronometrics users can view this chart with live updates here]
In our ‘In Charts’ series, we work to tell some of the stories that are moving the industry. Feel free to take a look at the other articles by clicking here.
All pricing is for domestic US produce, representing the spot market at Shipping Point (i.e. packing house/climate controlled warehouse, etc.). For imported fruit, the pricing data represents the spot market at Port of Entry.
You can keep track of the markets daily through Agronometrics, a data visualization tool built to help the industry make sense of the huge amounts of data that professionals need to access to make informed decisions. If you found the information and the charts from this article useful, feel free to visit us at www.agronometrics.com where you can easily access these same graphs, or explore the other 20 fruits we currently track.


Subscribe to our newsletter


