


Better blueberry trade data on the way


In this installment of the ‘Agronometrics In Charts’ series, Colin Fain illustrates how the U.S. market is evolving. Each week the series looks at a different horticultural commodity, focusing on a specific origin or topic visualizing the market factors that are driving change.


On October 21, 2021, the USDA Foreign Agricultural Service (FAS) published a report titled Blueberries Around the Globe – Past, Present, and Future.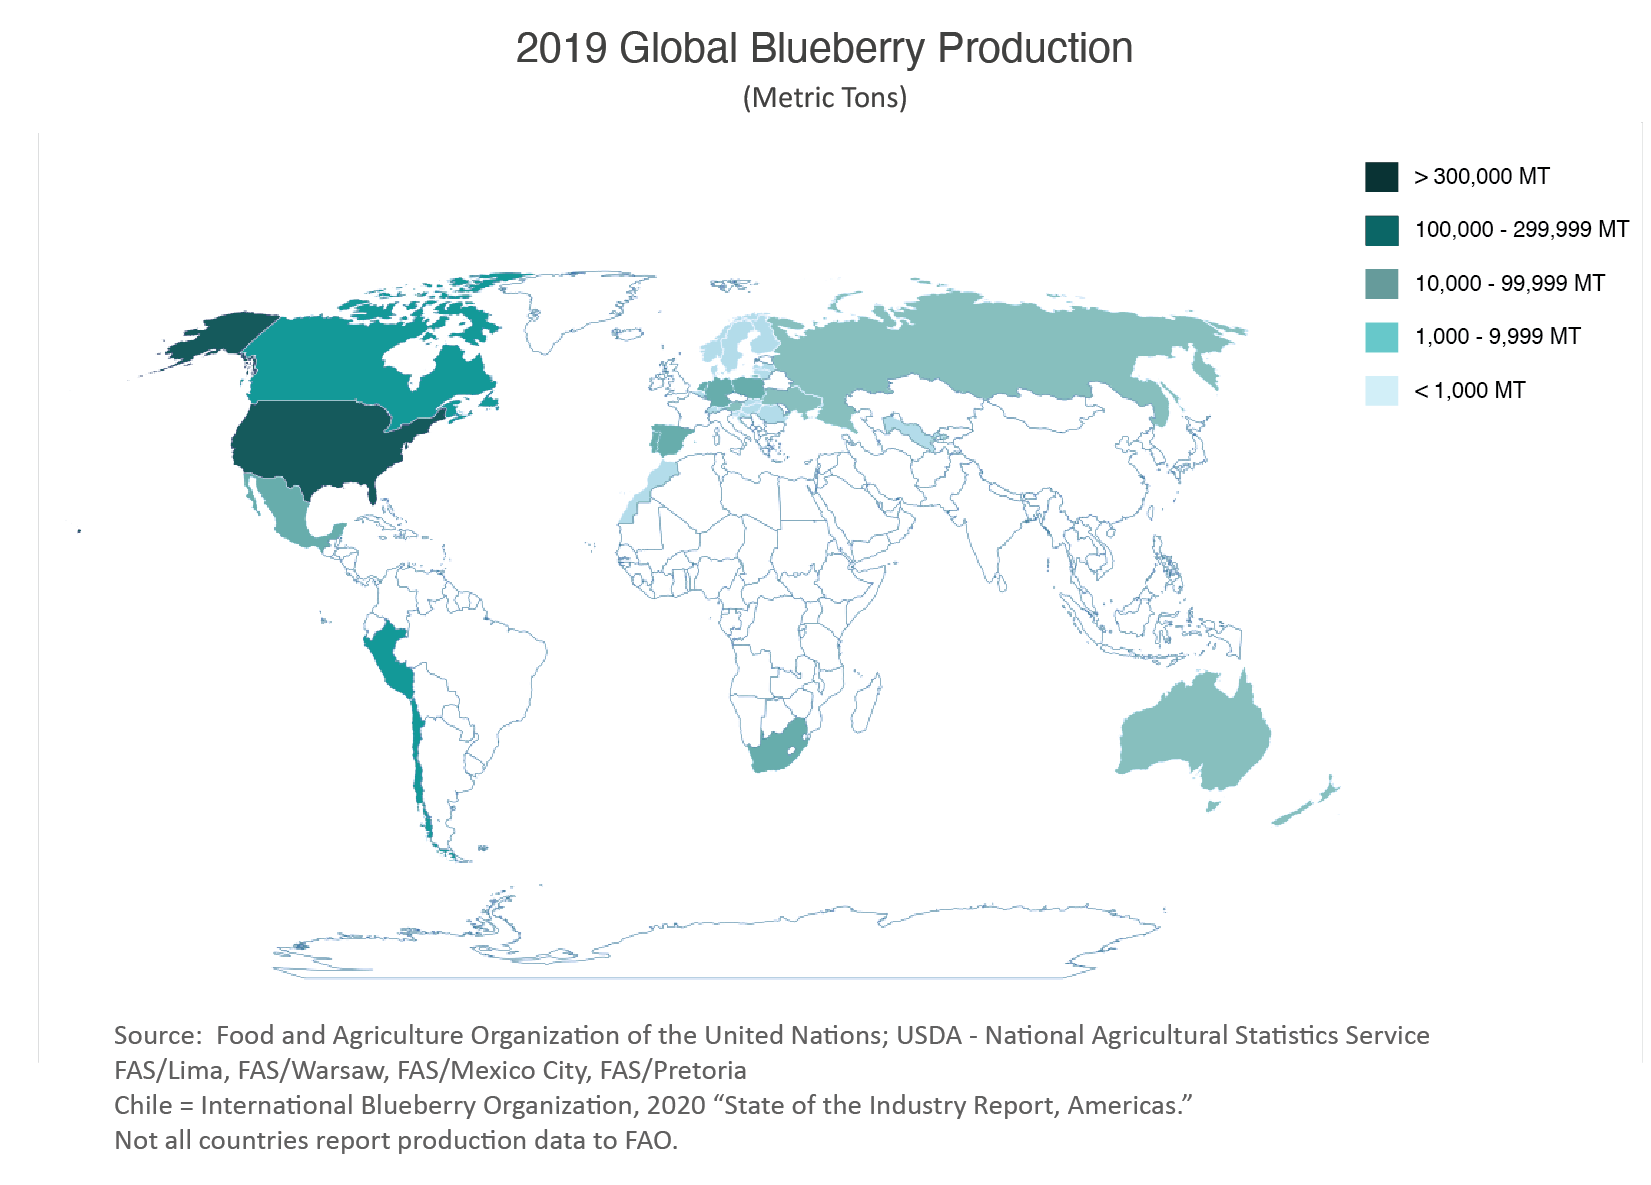
The report gives a brief overview of the commodity from its origin in New Jersey to its global reach up to 2019.
The six-page report looks at production, exports and where the author believes the industry is headed from here, which mostly touches on the impact of genetics and the expansion of production to warmer climates.
The last section in the USDA report covers better trade data. This got my attention as the work we have done putting together the International Blueberry Organizations (IBO) Global State of the Blueberry Industry Report requires quite a bit of work to isolate blueberry trade data from the other categories that are reported within the same harmonized shipping code.
To my delight, it appears that the USDA FAS has submitted a request to have the World Customs Organization (WCO) create individual headings for fresh, frozen and dried blueberry shipments.
This will greatly improve the resolution and availability of the trade data available to the industry on a global scale. The FAS request was made in September of 2021, and if all goes well, will take effect in 2027.
There is light at the end of the tunnel, but as some good things take time, bureaucracy has to do what it does. In the meantime, our team has gotten quite good at doing the work with trade data to tease out global trends, so reliable data will be available in the meantime.
Should there be interest in a much more complete overview compiled from the most important voices in the industry, I invite readers to take a look at the IBO’s Global State of the Blueberry Industry Report.
The report which Agronometrics co-authored is being made available for free and offers a much deeper dive into the subject, consisting of 160 pages.
It has received a great many accolades and some blueberry industry fanatics may have even considered describing it as exhilarating.
In our ‘In Charts’ series, we work to tell some of the stories that are moving the industry. Feel free to take a look at the other articles by clicking here.
All pricing is for domestic US produce, representing the spot market at Shipping Point (i.e. packing house/climate-controlled warehouse, etc.). For imported fruit, the pricing data represents the spot market at Port of Entry.
You can keep track of the markets daily through Agronometrics, a data visualization tool built to help the industry make sense of the huge amounts of data that professionals need to access to make informed decisions. If you found the information and the charts from this article useful, feel free to visit us at www.agronometrics.com where you can easily access these same graphs, or explore the other 20 fruits we currently track.


Subscribe to our newsletter


