


Agronometrics in Charts: High volumes of Peruvian blueberries push prices down in U.S. market


In this installment of the ‘Agronometrics In Charts’ series, Cristian Crespo F. illustrates how the U.S. market is evolving. Each week the series looks at a different horticultural commodity, focusing on a specific origin or topic visualizing the market factors that are driving change.


In this week's article of the "Agronometrics in Charts" series, we will look at blueberry volumes and prices in the U.S. market.
In previous articles, we have been addressing historic blueberry shipments to the world and the U.S. in particular.
Peru exports blueberries to more than 31 international markets and produces in the Lambayeque, La Libertad, Lima, Ica, Ancash, Piura and Moquegua areas.
In the graph below we can see the explosive increase in Peruvian blueberry exports to the U.S. over the last seven years, wherein 2020 the country exported a total of almost 57 million kilograms.
Historical volume of Peruvian blueberries in the U.S. market (KG)
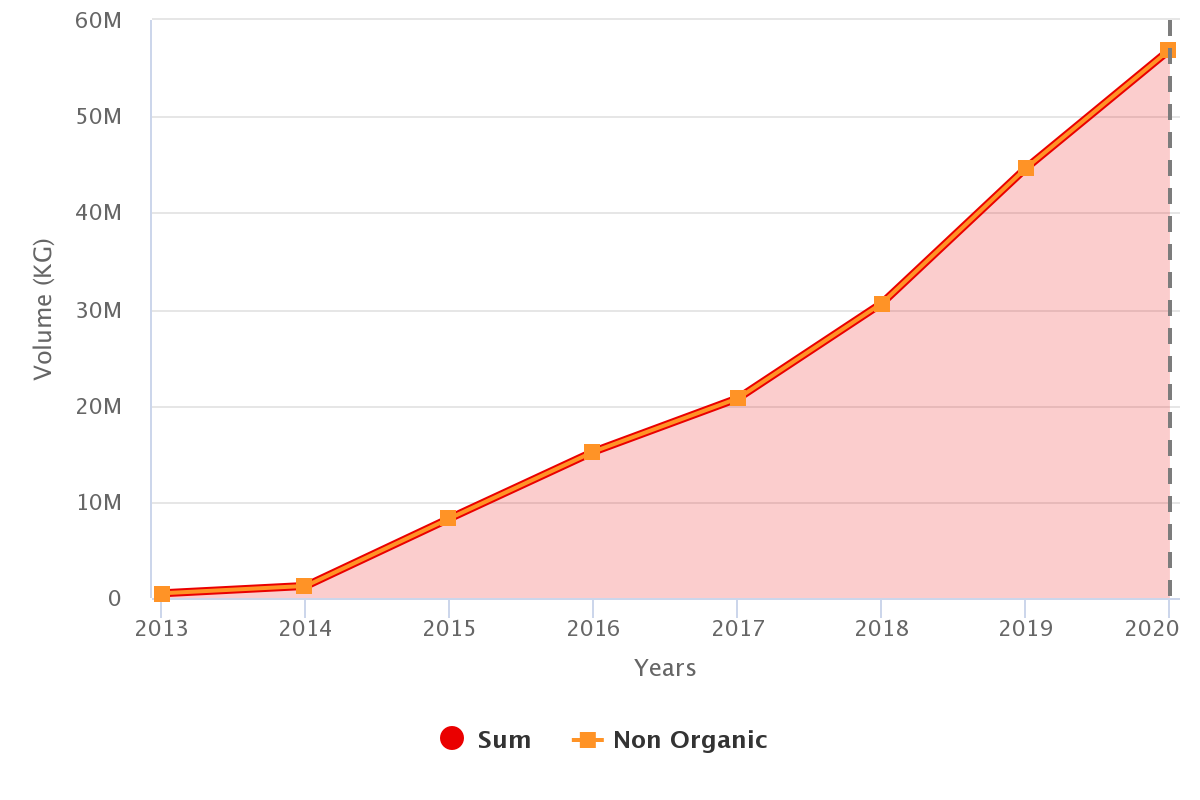
(Source: USDA Market News via Agronometrics) [Agronometrics users can view this chart with live updates here]
Looking at the graph below we can see the historical volume of blueberries in the countries of South America and Central America.
Peru has exponentially increased its blueberry shipments, closely followed by Mexico, while Chile remained stable and Argentina saw a downward trend.
Historical volume of blueberries from Argentina, Chile, Mexico and Peru in the U.S. market (KG)
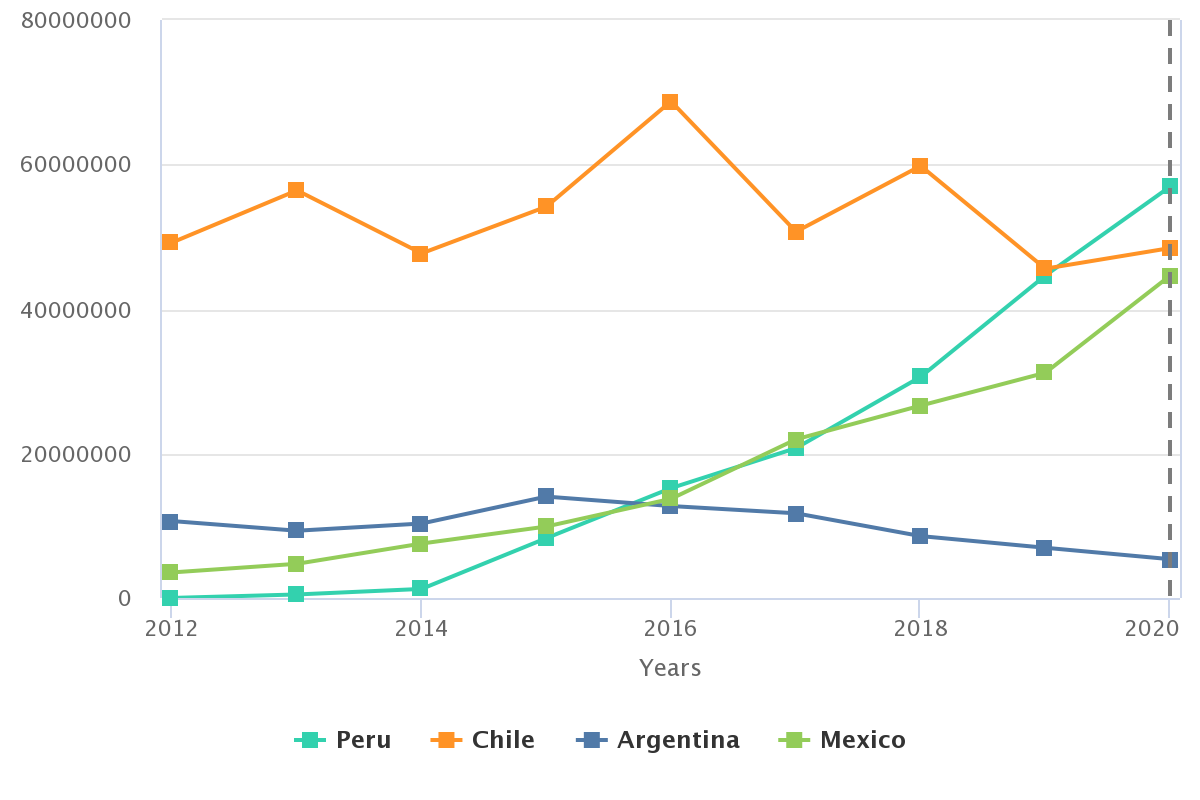
(Source: USDA Market News via Agronometrics)[Agronometrics users can view this chart with live updates here]
This significant increase in the volume of fruit from Peru and Mexico mainly, despite the demand of the North American market which is growing, may be a fundamental factor that is making prices less attractive for exporters and producers.
You can see in the following graph that in week 47 of 2021, the average prices for conventional blueberries in the U.S. market were US$3.97 per kilogram, 27 percent lower than in 2020.
The prices that are being registered are blueberries arriving from Mexico and Peru.
Prices (in USD / Kg) of conventional blueberries in the US market.

(Source: USDA Market News via Agronometrics) [Agronometrics users can view this chart with live updates here]
As we already mentioned at the beginning, the decrease in blueberry prices year-on-year may be due to a significant increase in blueberry supplies from Peru, especially over the last weeks as can be seen in the graph below.
It should be added that Mexico's volumes in 2021 have also been higher than in 2020, although on a smaller scale.
Volumes (in Kg) of blueberries from Peru in the US market.

(Source: USDA Market News via Agronometrics) [Agronometrics users can view this chart with live updates here]
What will happen in the next few years? Will Peru's export growth be sustainable at this rate? Will Mexico continue to grow? What will happen to Chile?
Will Argentina become more active? Will new emerging markets such as Colombia make their mark? Can the North American market absorb the large volumes of blueberries that lie ahead? Will a saturated blueberry market happen in Peru, like it did in Chile?
Certainly very important questions, the answers to which will determine the future of the blueberry market in the United States. We'll be alert!
In our ‘In Charts’ series, we work to tell some of the stories that are moving the industry. Feel free to take a look at the other articles by clicking here.
You can keep track of the markets daily through Agronometrics, a data visualization tool built to help the industry make sense of the huge amounts of data that professionals need to access to make informed decisions. If you found the information and the charts from this article useful, feel free to visit us at www.agronometrics.com where you can easily access these same graphs, or explore the other 20 fruits we currently track.


Subscribe to our newsletter


