


Agronometrics in Charts: Citrus prices in the U.S. market


In this installment of the ‘In Charts' series, Cristian Crespo of Agronometrics illustrates how the U.S. market is evolving. Each week the series looks at a different horticultural commodity, focusing on a specific origin or topic visualizing the market factors that are driving change.


In this week's article, we will look at average citrus fruit prices (for the "spot" market), specifically grapefruit, lemons, oranges, limes, clementines and tangerines in the U.S. market in comparison to previous years.
Grapefruit
We are going to begin our tour with grapefruit, which has seen higher prices throughout this year in comparison to last year and which has been more prominent in the last three weeks.
If we look at the graph below, we can see that in week 51 of 2021, the average price for conventional grapefruits was around US$1.69 per kilogram, a 22 percent increase year-on-year. Fruit supplies in the U.S. market are currently being recorded from Mexico and Texas.
Non-organic grapefruit prices in the U.S. market (USD/KG)
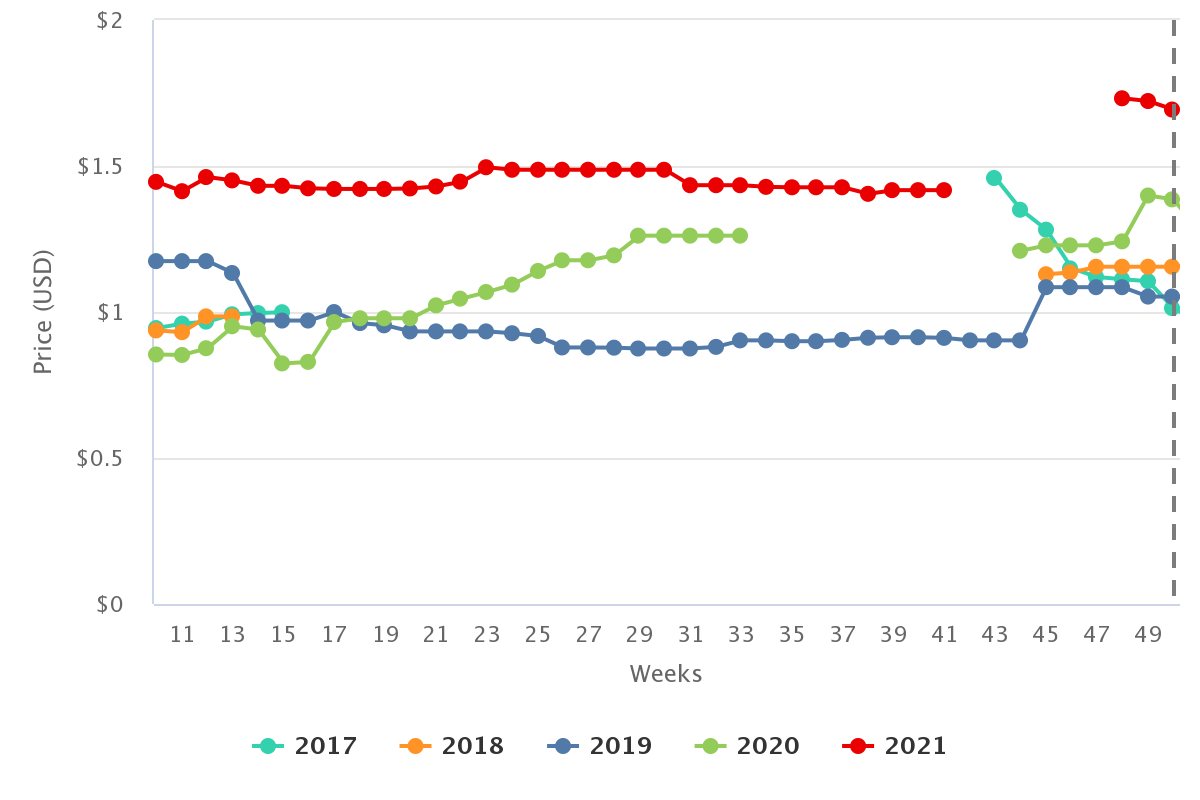
(Source: USDA Market News via Agronometrics) [Agronometrics users can view this chart with live updates here]
Lemons
Regarding lemons, average prices during almost all of 2021 were largely above those of last year. Only from week 43 did we see this difference begin to narrow and in week 51 prices were slightly below those of 2020.
As can be seen in the following graph, week 51 of 2021 saw average prices of conventional lemons at US$1.53 per kilogram, one percent lower than in 2020. Lemon supplies are currently being recorded from California and Arizona.
Non-organic lemon prices in the U.S. market (USD/KG)

(Source: USDA Market News via Agronometrics) [Agronometrics users can view this chart with live updates here]
Oranges
The prices of non-organic oranges in the U.S. market between weeks 1 and 20 of 2021, were higher year-on-year. Between weeks 22 and 47 in 2021, prices were lower than those of 2020, however, in the last three weeks prices registered above those in 2020.
Looking at the graph below, in week 51, the average price of conventional oranges was US$1.37 per kilogram, a 12 percent increase year-on-year. The supply origins of oranges in the U.S. market are currently California, Mexico, Arizona and Texas.
Non-organic orange prices in the U.S. market (USD/KG)

(Source: USDA Market News via Agronometrics) [Agronometrics users can view this chart with live updates here]
Limes
Between weeks 3 and 23, prices of non-organic limes in the U.S. market were higher year-on-year. Then between weeks 24 and 41 they were similar, but in these last weeks, the average prices of limes were once again above those of 2020.
If we look at the graph below, in week 51, the average price of conventional limes was US$0.86 per kilogram, 51 percent higher than in 2020. The only source of lime supply in the U.S. market is Mexico.
Non-organic lime prices in the U.S. market (USD/KG)

(Source: USDA Market News via Agronometrics) [Agronometrics users can view this chart with live updates here]
Clementines
Non-organic clementines in the U.S. market saw simial prices to 2020 during almost every week of this year. Only in the last weeks have clementine prices been lower than in 2020.
The graph below shows that in week 50 of 2021, the average price of conventional clementines was US$1.78 per kilogram, a 41 percent drop year-on-year. Clementine supplies in the U.S. market is Morocco.
Non-organic clementine prices in the U.S. market (USD/KG)
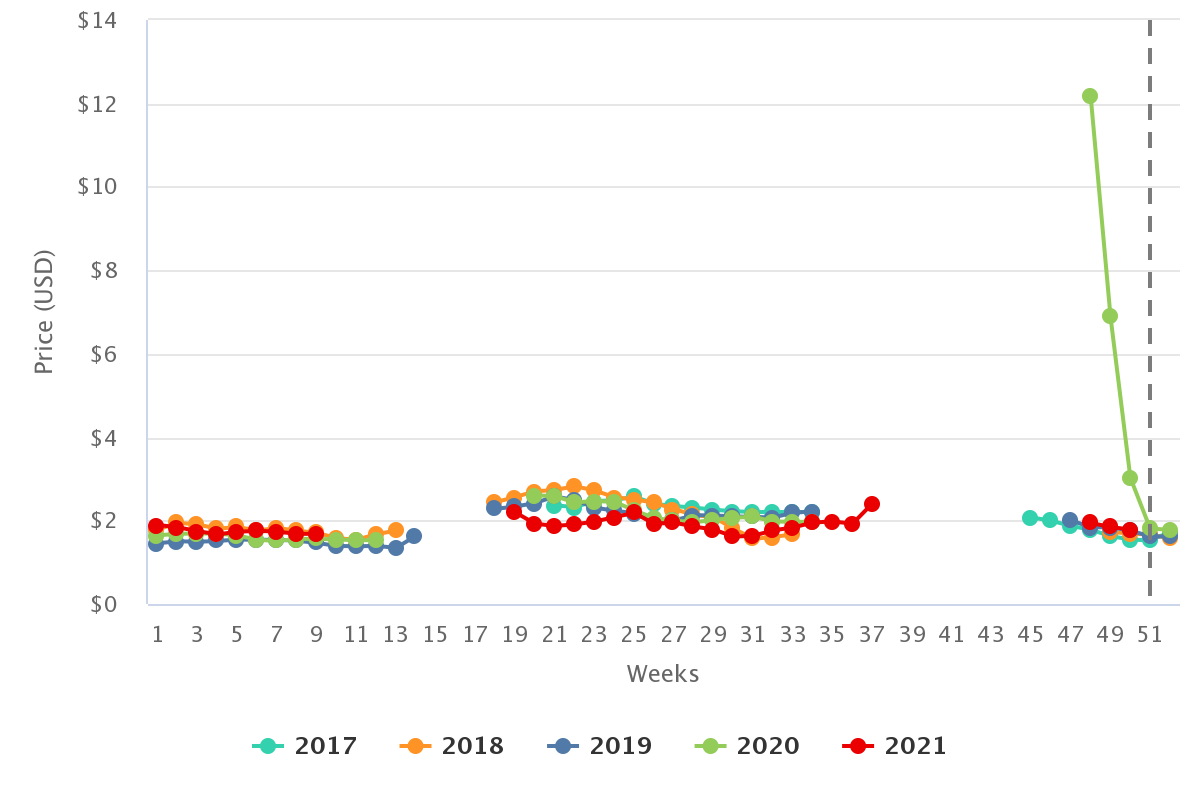
(Source: USDA Market News via Agronometrics) [Agronometrics users can view this chart with live updates here]
Tangerines
The prices of non-organic tangerines in the U.S. market have been higher than those of 2020 during weeks 33 to 46.
If we look at the graph below, in week 48 of 2021 (the last recorded prices), the average price of conventional tangerines was US$1.84 per kilogram, very similar to 2020. Tangerines to the U.S. market are supplied by Chile, Morocco, Mexico and Peru.
Non-organic tangerine prices in the U.S. market (USD/KG)

(Source: USDA Market News via Agronometrics) [Agronometrics users can view this chart with live updates here]
In our ‘In Charts’ series, we work to tell some of the stories that are moving the industry. Feel free to take a look at the other articles by clicking here.
You can keep track of the markets daily through Agronometrics, a data visualization tool built to help the industry make sense of the huge amounts of data that professionals need to access to make informed decisions. If you found the information and the charts from this article useful, feel free to visit us at www.agronometrics.com where you can easily access these same graphs, or explore the other 20 fruits we currently track.


Subscribe to our newsletter


