Agronometrics in Charts: Logistical constraints continue to afflict Chilean blueberry exports

In this installment of the ‘Agronometrics In Charts’ series, Sarah Ilyas studies the advent of the Chilean blueberry season and analyzes its projected impact on the US market. Each week the series looks at a different horticultural commodity, focusing on a specific origin or topic visualizing the market factors that are driving change.
As of late December, exports of Chilean blueberries decreased by approximately 24.1 percent in comparison to last season, owing to longer maritime transit times, paucity of port workers and a lack of containers.
Despite the logistical predicaments faced by Chilean blueberries this season, things are looking up as the incoming volumes continue to soar.
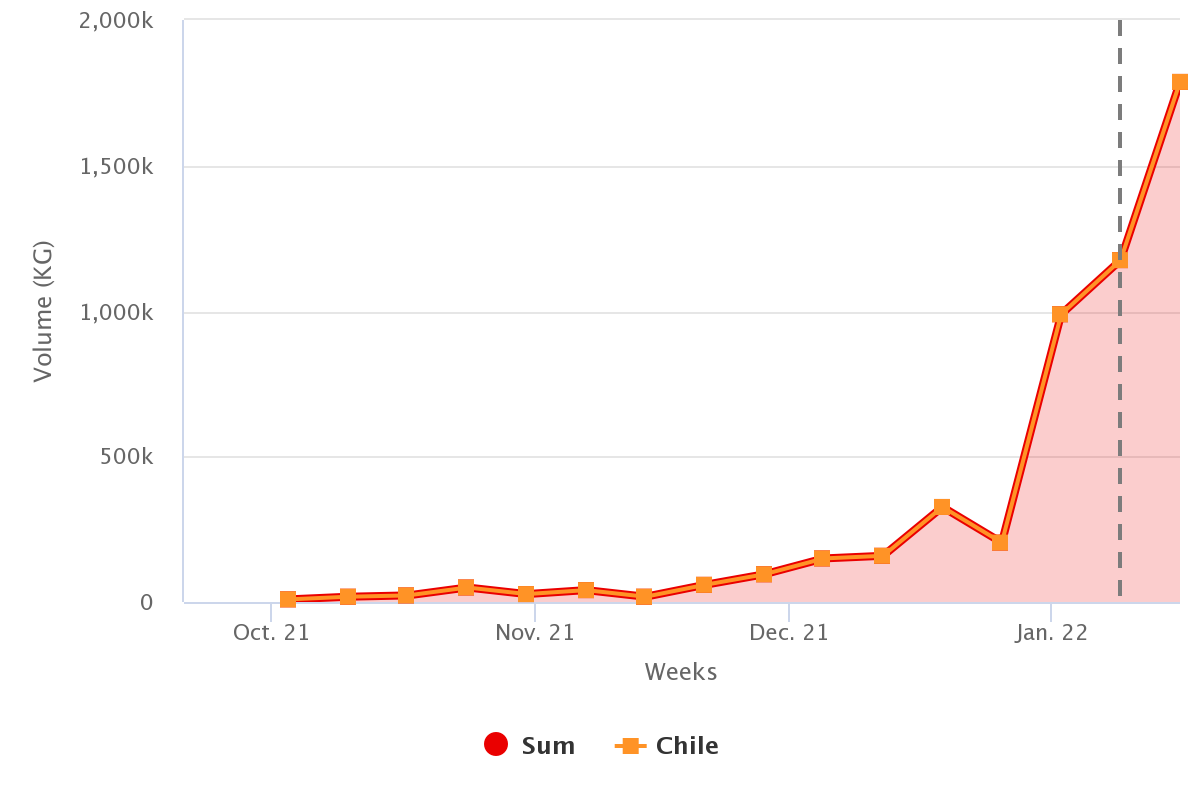
As can be observed in the graph below, there was a steep rise in the imported volumes following the end of December with peak volumes being recorded at 1.7 M kgs.
Blueberry Volumes (Kg) from Chile
Source: USDA Market News via Agronometrics. (Agronometrics users can view this chart with live updates here)
The graph below exhibits the flow of blueberries to the US from various origins through the course of the blueberry season; Peru, incontrovertibly, was on the forefront with the peak imported volume recorded at 8.8M, followed by Canada, Mexico and Chile.
As the season reels out, higher volumes of Chilean blueberries could be expected.
It is important to note, however, that more stable pricing for blueberries in the European market compared to the U.S. market would make an impact on the quantities exported to the US.
Blueberry Volumes by Origin (Kg) from Chile, Peru, Mexico and Canada
Source: USDA Market News via Agronometrics (Agronometrics users can view this chart with live updates here)
According to estimates from an industry source, the dearth of labor in Chile will reduce the harvest of fresh blueberries by 7% of its potential production.
Additionally, the increase in maritime transit times is causing many farmers to be more thorough with the selection of the fruit, exporting only that which has the likelihood to remain in good condition during the long haul.
This is causing the frozen blueberry market to expand in Chile and will likely increase the production of frozen blueberries by 10% in comparison to the previous season.
Eighteen percent of total blueberry exports this season are expected to be organic according to Karen Brux, general director of the Chilean Fresh Fruit Association.
“The United States receives a greater allocation of organic quantities, so the organic volume sent to this market could reach 28% of the total," she said.
Nonorganic blueberries have been taking the lead, with quantities culminating at 1 M kgs in the first week of January while the highest quantities reported for the organic types were 159 thousand kgs, as can be observed from the graph below.
Blueberry Volumes by Type (Kg) from Chile
Source: USDA Market News via Agronometrics (Agronometrics users can view this chart with live updates here)
Chilean blueberries received the Heart-Check certification from the American Heart Association last season.
“We are thrilled to receive the Heart-Check certification from the American Heart Association,” Andres Armstrong, Executive Director of the Chilean Blueberry Committee said to a news source within the industry.
“We look forward to communicating this in both our consumer and retail promotions for Blueberries from Chile, helping individuals to make healthier choices when thinking about their next purchase or when meal prepping at home.”
January and February are the prominent promotion months for Chilean Blueberries; the Chilean Blueberry Committee is partnering with retailers from across the US to propel blueberry sales by virtue of digital marketing campaigns that feature web banners, coupons, and ads.
The extensive ‘Fruits from Chile’ social media platforms will also feature health benefits and usage ideas for Chilean blueberries.
There are a multitude of factors that will ascertain the inflow of Chilean blueberries into the US in the upcoming weeks.
While the effects of logistical constraints cannot be easily dismissed, there is no doubt that Chilean blueberries are one of a kind and can outdo many other varieties on that merit alone.
In our ‘In Charts’ series, we work to tell some of the stories that are moving the industry. Feel free to take a look at the other articles by clicking here.
All pricing is for domestic US produce, representing the spot market at Shipping Point (i.e. packing house/climate controlled warehouse, etc.). For imported fruit, the pricing data represents the spot market at Port of Entry.
You can keep track of the markets daily through Agronometrics, a data visualization tool built to help the industry make sense of the huge amounts of data that professionals need to access to make informed decisions. If you found the information and the charts from this article useful, feel free to visit us at www.agronometrics.com where you can easily access these same graphs, or explore the other 20 fruits we currently track.


