

Agronometrics in Charts: Peru’s dramatic increase in blueberry production sends pricing to an all time low


In this installment of the ‘Agronometrics In Charts’ series, Sarah Ilyas studies the changeover in seasonal inflow of Peruvian blueberries. Each week the series looks at a different horticultural commodity, focusing on a specific origin or topic visualizing the market factors that are driving change.


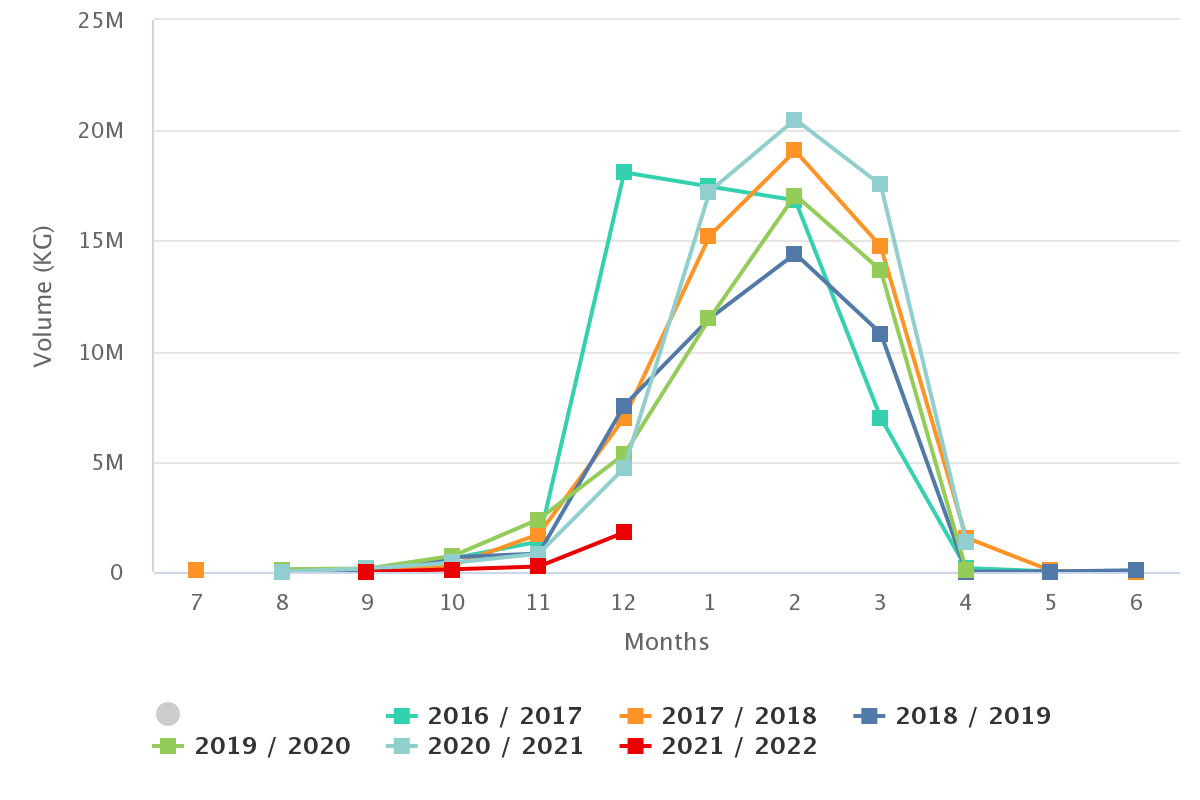
Lately the US has been witnessing a surge in the volumes of imported Peruvian blueberries. The graph below displays the incoming volumes of Peruvian blueberries over the course of the last five years.
Peru shipped a total of 443 million pounds of fresh blueberries worldwide this season, representing a growth of about 32 percent compared to the previous season; approximately 54 percent of this quantity was shipped to the US, claims Luis Vegas, the Manager of the Peruvian Blueberry Growers & Exporters Association.
The graph below exhibits the imported blueberry quantities in the US peaking at a total volume of 30 M kgs.
According to the latest forecasts, a growth of about 37 percent is expected in quantities shipped to the US by the end of this season in comparison to the previous season.
Blueberry Volumes by History (Kg) from Peru

Source: USDA Market News via Agronometrics. (Agronometrics users can view this chart with live updates here)
Shipments from Peru are expected to trickle in until the first weeks of March. Every year, the Peruvian season is a harbinger of the Chilean season, this year is no exception.
The graph below shows Chile picking up from the lull in Peruvian blueberry shipments. The peak incoming volume recorded yet was 2.1 M kg in week 2.
Chilean blueberry shipments kick off in October, as seen in the graph below, and continue to pour in until April.
Blueberry Volumes by Origin (Kg) from Chile and Peru

Source: USDA Market News via Agronometrics. (Agronometrics users can view this chart with live updates here)
The graph below shows the inflow of Chilean blueberries by history. As can be noticed, there were no major spikes in incoming volumes such as those observed for Peru.
Logistical difficulties continue to be an obstacle; limited availability of labor, land transportation and containers, together with longer transit times and congestion at destination ports have been hindering the exporters and importers since the start of the season.
According to Andrés Armstrong, executive director of the Chilean Blueberry Committee, a 9.2 percent decrease was recorded in exported volumes by the end of 2021, compared to 2020.
Blueberry Volumes by History (Kg) from Chile
Source: USDA Market News via Agronometrics. (Agronometrics users can view this chart with live updates here)
The graph below captures the price for Peruvian blueberries as recorded in the US market.
As can be noticed, the 2022/2021 season saw slightly higher peak prices when compared to the 2021/2020 season.
The highest price recorded this season was $ 11.67, compared to $9.78 last season. Thereafter, the higher quantities had a substantial impact on prices seeing them more than halved compared to the previous season, offering the lowest prices Peru has seen to date.
Importantly we can see that as Peru’s volumes decreased, the market increased considerably, offering a more attractive commercial landscape for Chilean fruit as it makes its way north.
Blueberry Prices by History (USD/Kg) from Peru
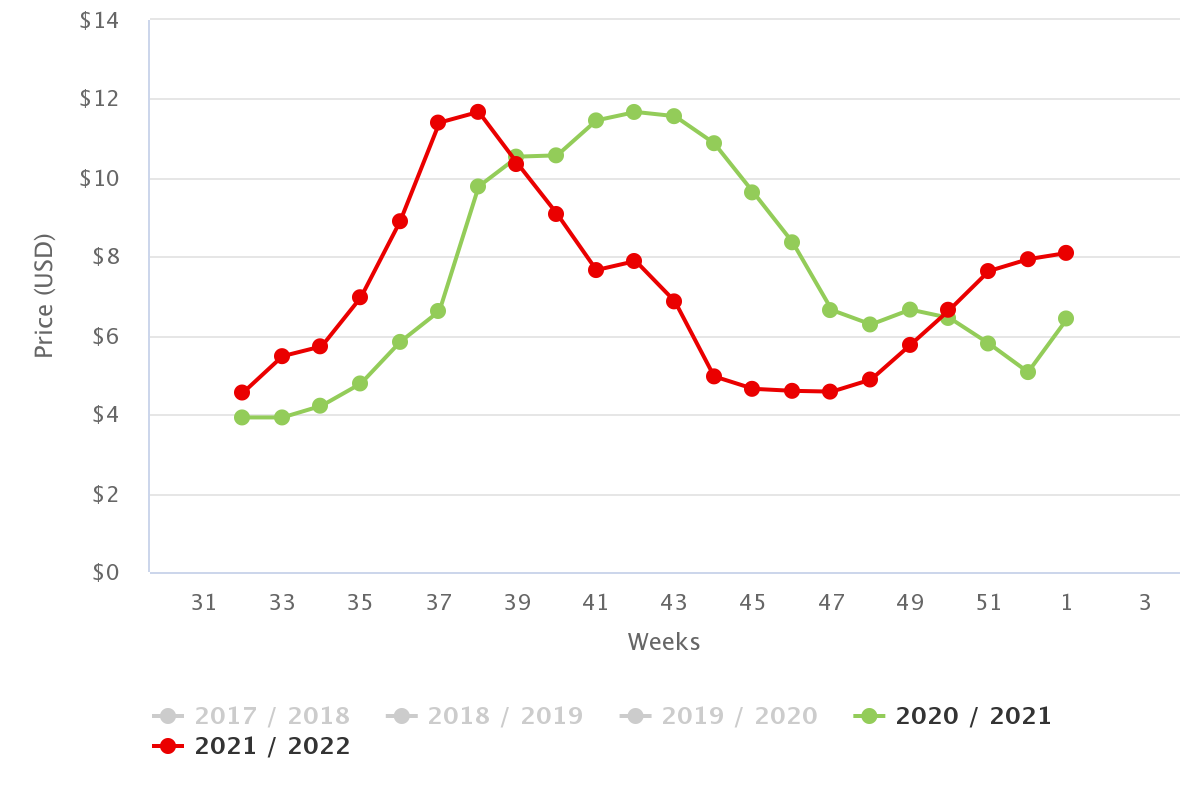
Source: USDA Market News via Agronometrics. (Agronometrics users can view this chart with live updates here)
As corroborated by the data from the State of the Industry Report, owing to larger investments by the private sector, commercial policies of opening new markets and an increasingly growing participation of small producers in the interior of the country, Peru’s productive development has proliferated in recent years.
Peru is using blueberries as an instrument to boost the development of other production chains and, above all, to alleviate poverty within the country, it is thus no wonder that Peru’s blueberry exports are witnessing an exponential growth.
In our ‘In Charts’ series, we work to tell some of the stories that are moving the industry. Feel free to take a look at the other articles by clicking here.
All pricing for domestic US produce represents the spot market at Shipping Point (i.e. packing house/climate controlled warehouse, etc.). For imported fruit, the pricing data represents the spot market at Port of Entry.
You can keep track of the markets daily through Agronometrics, a data visualization tool built to help the industry make sense of the huge amounts of data that professionals need to access to make informed decisions. If you found the information and the charts from this article useful, feel free to visit us at www.agronometrics.com where you can easily access these same graphs, or explore the other 21 commodities we currently track.


Subscribe to our newsletter