


Agronometrics in Charts: High temperatures deal a heavy blow to blackberry production in Mexico


In this installment of the ‘Agronometrics In Charts’ series, Sarah Ilyas studies the state of the Mexican blackberry market. Each week the series looks at a different horticultural commodity, focusing on a specific origin or topic visualizing the market factors that are driving change.


According to the USDA’s Economic Research Service, Mexico represents 97 percent of the USA’s fresh blackberry imports. 96 percent of this volume comes from the state of Michoacán.
Blackberry production in Mexico grew substantially in the early 2000s. In 2017, Mexico occupied 97% of the market share for fresh blackberries imported into the United States, while Chile captured 61% of the market share for American imports of frozen blackberries.
While once based on the cultivar 'Brazos', an old erect blackberry cultivar developed in Texas in 1959, the Mexican industry is now dominated by the Brazilian 'Tupy' released in the 1990s.
The 'Tupy' has the erect blackberry 'Comanche', and a ‘wild Uruguayan blackberry’ as parents. In order to produce these blackberries in regions of Mexico where there is no winter chilling to stimulate flower bud development, chemical defoliation and application of growth regulators are used to facilitate the blooming of the plants.
Climate plays a crucial role in the development of the fruit and the recent heat spells appear to have taken a toll on produced quantities
Due to a heatwave about three to four weeks ago in the beginning of March, the industry is dealing with a shortage. It has caused a lot of fruit to drop in the field and lowered quality, Stefanie Katzman, executive vice-president, S. Katzman Produce said in an industry publication. Volumes in week 18 stood at 2.5 K tonnes. This is an 11 percent increase compared to the previous season, which was also heavily affected by production issues.
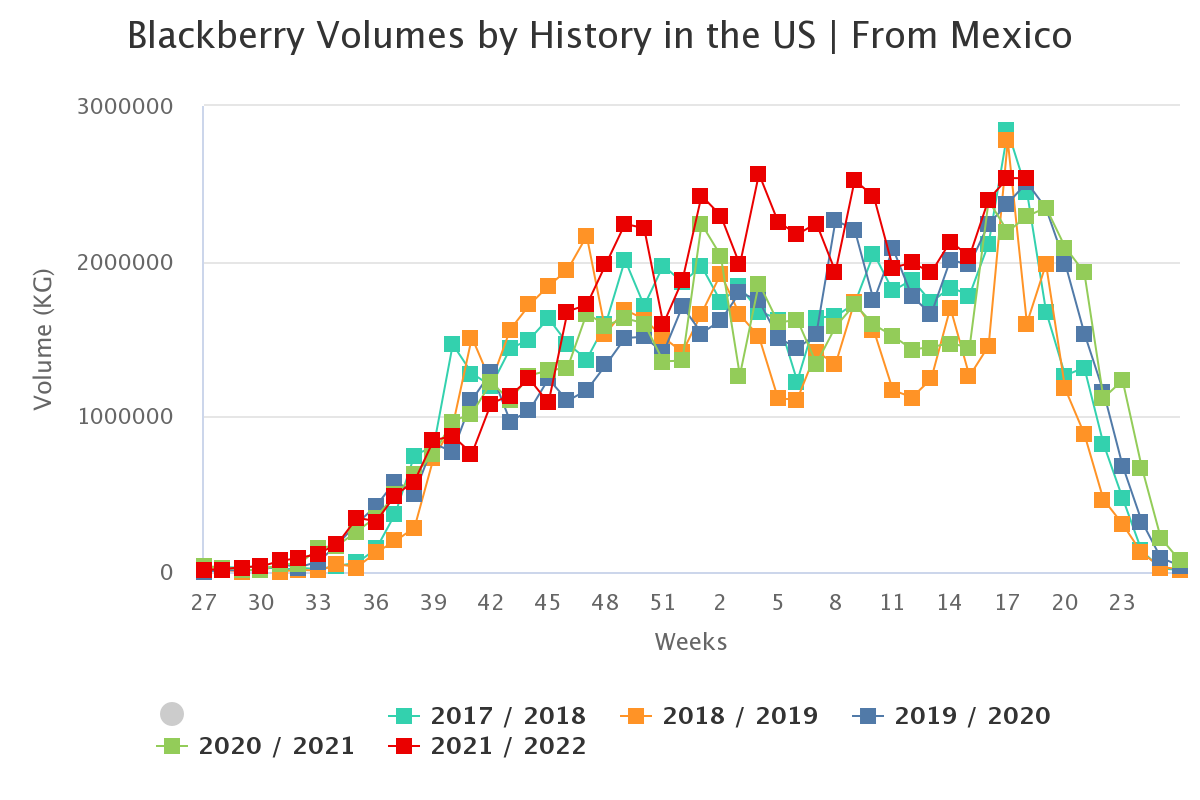
(Source: USDA Market News via Agronometrics. Agronometrics users can view this chart with live updates here)
Pricing so far has been high due to the scarcity of supply. When supply falls, there is usually a spike in prices, and the eating experience is generally better when there is more volume from the harvest, says Katzman.
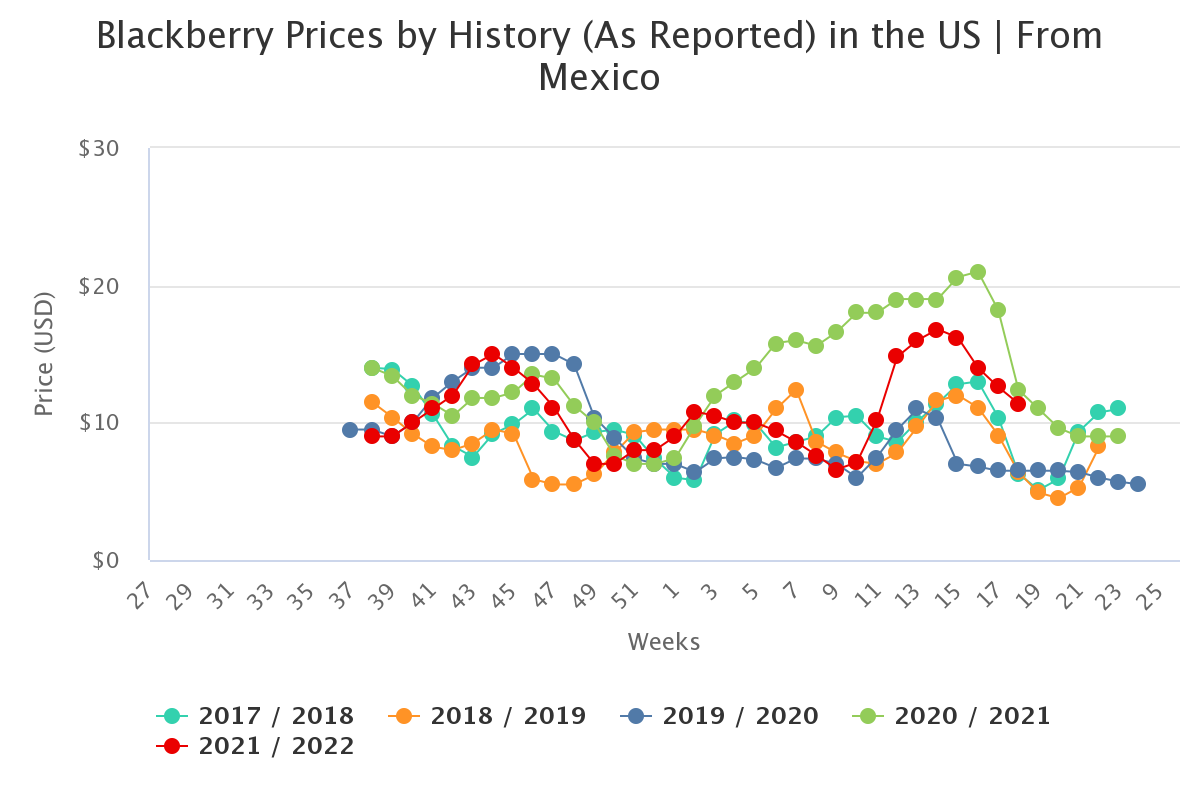
(Source: USDA Market News via Agronometrics. Agronometrics users can view this chart with live updates here)
Many growers are currently focusing on varietal replacement. The variety, Tupy, which still holds the majority in terms of planted area, has recently been in danger due to pathogens such as Fusarium.
The majority of the main export companies already have proprietary or exclusive varieties in pursuit of higher yields and superior quality. Over the course of the next few years, growers will undergo a process of trial and error, since not all varieties can adapt well to areas of cultivation.
In around 3-5 years, production may increase exponentially. A goal of farmers has also been to extend the growing season of berries while keeping costs to a minimum. This can be achieved by virtue of high tunnel production. High tunnels are large hoop houses covered in plastic that cost a fraction of greenhouse production. A
According to a research conducted by Cornell University in 2017, the implementation of high tunnels allows for a longer season with summer-bearing varieties producing fruit as early as May and fall-bearing varieties continuing to produce fruit into November. Berries are sold at a premium price early and late in the season, therefore an extended season enables farmers to acquire a bigger share of the market.

(Source: USDA Market News via Agronometrics. Agronometrics users can view this chart with live updates here)
In our ‘In Charts’ series, we work to tell some of the stories that are moving the industry. Feel free to take a look at the other articles by clicking here.
All pricing for domestic US produce represents the spot market at Shipping Point (i.e. packing house/climate controlled warehouse, etc.). For imported fruit, the pricing data represents the spot market at Port of Entry.
You can keep track of the markets daily through Agronometrics, a data visualization tool built to help the industry make sense of the huge amounts of data that professionals need to access to make informed decisions. If you found the information and the charts from this article useful, feel free to visit us at www.agronometrics.com where you can easily access these same graphs, or explore the other 21 commodities we currently track.


Subscribe to our newsletter


