


Agronometrics in Charts: Will the U.S. market retain the drop in Hass avocado pricing?


In this installment of the ‘Agronometrics In Shorts’ series, Sarah Ilyas studies the latest incidence of the drop in Hass avocado pricing in the US Market. Each week the series looks at a different horticultural commodity, focusing on a specific origin or topic visualizing the market factors that are driving change.


The average daily prices of avocados in the U.S. have fallen by 6.99 percent, marking a $2.58 decrease on the last report 3 days ago, from $36.98 to $34.40.
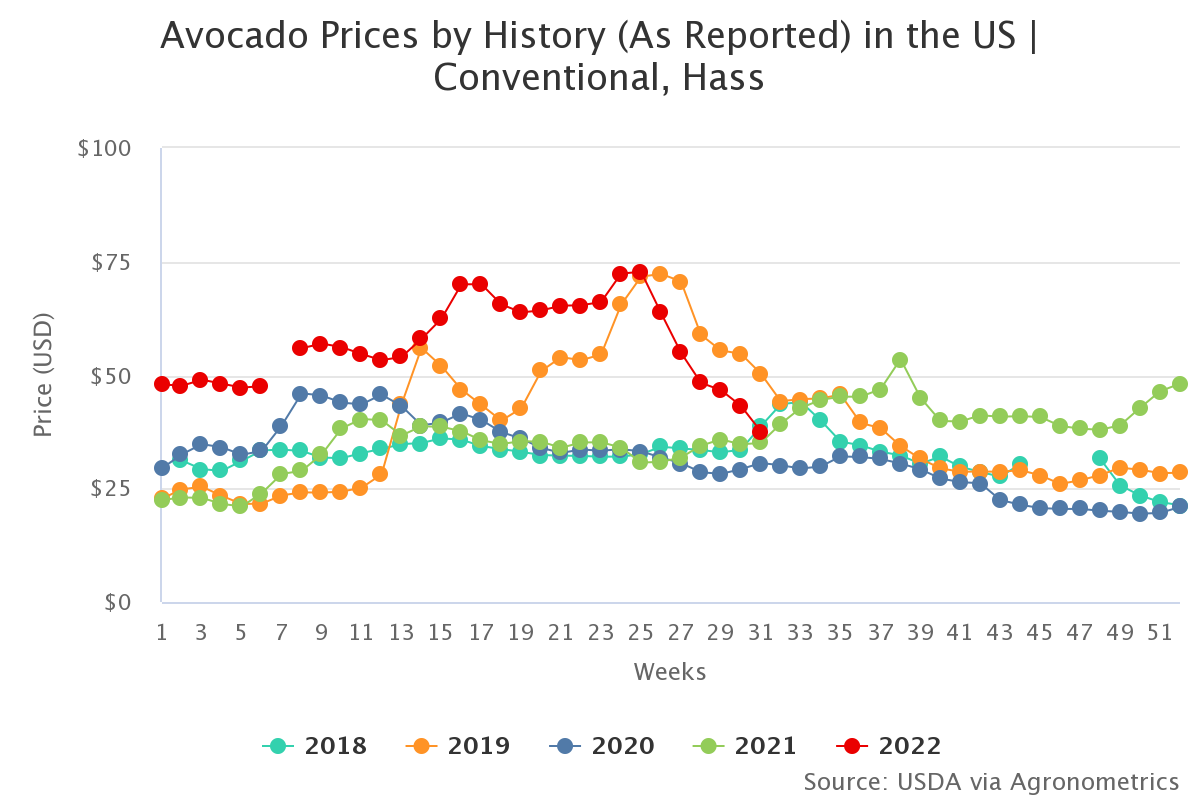
Source: USDA Market News via Agronometrics. (Agronometrics users can view this chart with live updates here)
As for Hass avocado pricing with respect to sizing, the average was $34.31 per package on August 9. 32s saw the highest recorded price at $41.13 per package while 84s saw the lowest price recorded at $26.25 per package.

Source: USDA Market News via Agronometrics. (Agronometrics users can view this chart with live updates here)
We can take an average over the last two months to make a rough estimation of how much fruit is actually moving into the market. By this calculation, 2022 has moved 16 percent less volume compared to 2021.

Source: USDA Market News via Agronometrics. (Agronometrics users can view this chart with live updates here)
The average volume from California over the last 2 months has been around 11 percent lower than that received in 2021, while that from Peru has been roughly 44 percent higher; cumulative volumes were around 4 percent lower. Most of the volume came in from Mexico, albeit 25 percent lower in quantity compared to 2021.
The Hass Avocado Board is forecasting that over the course of the next eight weeks Peru is expected to send roughly 70 percent more volume compared to 2021, California is expected to send roughly 66 percent lower volumes. Mexico on the other hand is expected to retain volumes similar to 2021 with a 3-4 percent decrease.
This forecast suggests that prices should be lower over the next couple of months, dropping modestly by 3% - 10 percent compared to the previous year.

Source: USDA Market News via Agronometrics. (Agronometrics users can view this chart with live updates here)
In our ‘In Charts’ series, we work to tell some of the stories that are moving the industry. Feel free to take a look at the other articles by clicking here.
All pricing for domestic US produce represents the spot market at Shipping Point (i.e. packing house/climate controlled warehouse, etc.). For imported fruit, the pricing data represents the spot market at Port of Entry.
You can keep track of the markets daily through Agronometrics, a data visualization tool built to help the industry make sense of the huge amounts of data that professionals need to access to make informed decisions.
If you found the information and the charts from this article useful, feel free to visit us at www.agronometrics.com where you can easily access these same graphs, or explore the other 21 commodities we currently track.


Subscribe to our newsletter


