


Agronometrics in Charts: Chilean clementine exports fall by 39%


Valeria Concha studies shortly the state of the clementine market. Each week the series looks at a different horticultural commodity, focusing on a specific origin or topic visualizing the market factors that are driving change.


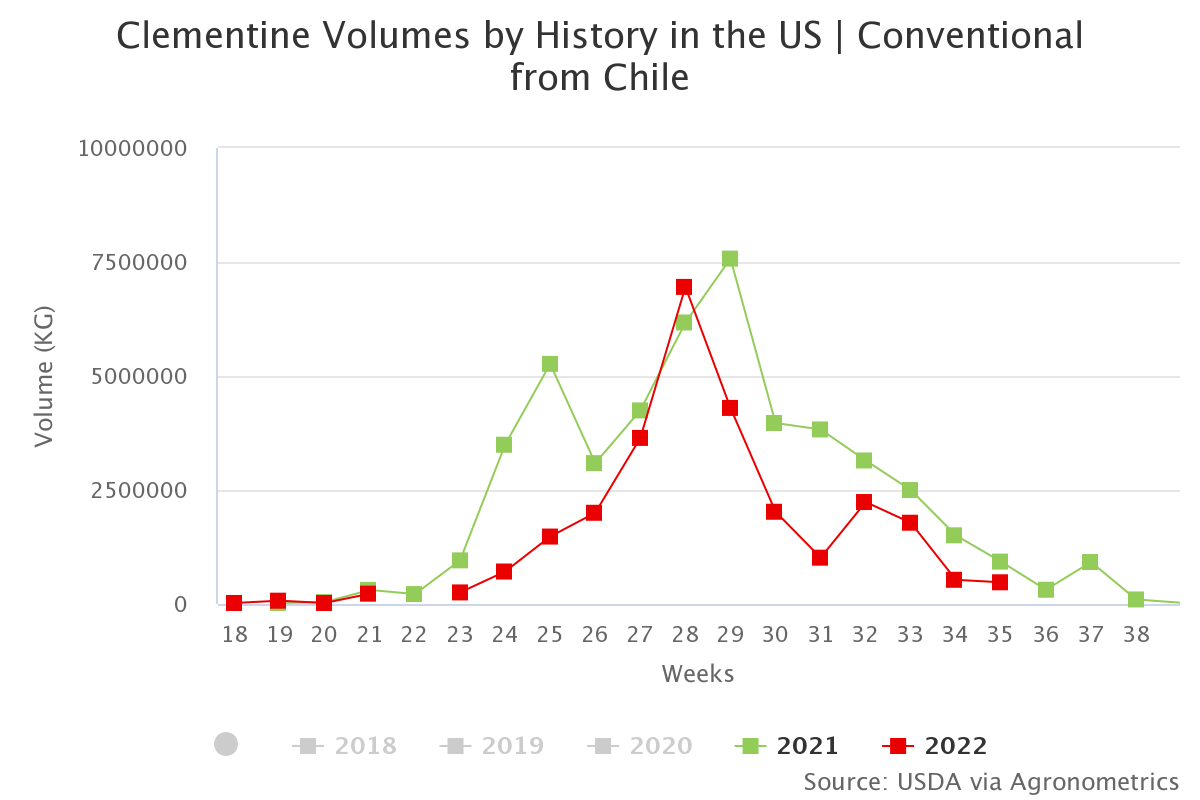
Currently, the supply of clementines in the US market is mainly made up of fruit from Chile, with small volumes from other origins such as Peru.
Coming to the end of the supply of clementines from the southern hemisphere, the accumulated volume from Chile reaches about 28,000 tons, 70% of the supply between weeks 18 and 35. While Peru contributed 14% of the supply of clementines, South Africa with 10% and Uruguay with 6%.

(Source: USDA Market News via Agronometrics. Agronometrics users can view this chart with live updates here)
According to the Citrus Committee of Chile, the 2022 Chilean Clementines season has ended, the United States being the main destination. As indicated, of the total exported, 98.6% were destined to the United States, of which 73% were allocated to the East Coast, and the remaining (27%), to the West Coast.
In turn, shipments accumulated until week 32 presented a 39% decrease, compared to the same week of the previous season. The main factor that influenced this decrease was the severe drought that the country faced during 2021, which has greatly affected the Coquimbo region, a region that concentrates the largest production of clementines in the country.
(Source: USDA Market News via Agronometrics. Agronometrics users can view this chart with live updates here)
During the first part of the 2022 season, the average daily price per kg of Chilean clementines was between 27% and 33% higher than that registered in 2021. As of week 31, this difference decreased (+17%), reaching week 35 the same value as last season, $1.98 per Kg.

(Source: USDA Market News via Agronometrics. Agronometrics users can view this chart with live updates here.)
In our ‘In Charts’ series, we work to tell some of the stories that are moving the industry. Feel free to take a look at the other articles by clicking here.
All pricing for domestic US produce represents the spot market at Shipping Point (i.e. packing house/climate controlled warehouse, etc.). For imported fruit, the pricing data represents the spot market at Port of Entry.
You can keep track of the markets daily through Agronometrics, a data visualization tool built to help the industry make sense of the huge amounts of data that professionals need to access to make informed decisions. If you found the information and the charts from this article useful, feel free to visit us at www.agronometrics.com where you can easily access these same graphs, or explore the other 21 commodities we currently track.


Subscribe to our newsletter


