


Agronometrics in Charts: US blueberry imports hit record 720B pounds amid weather-related crop declines


Each week, the series ‘Agronometrics In Charts’ looks at a different horticultural commodity, focusing on a specific origin or topic, and visualizing trade market factors that are driving change. Check out our entire archive.


The US blueberry market in 2025 was shaped by two major forces: weaker domestic shipments and record-breaking import volumes. Together, these trends highlight how global supply is playing a larger role in meeting US demand, according to a recently published report by the US Department of Agriculture (USDA).
US blueberry cultivation falls into two categories: cultivated (highbush) and wild (lowbush). Most production comes from cultivated varieties grown in states such as Washington, Oregon, Georgia, Michigan, California, North Carolina, New Jersey, and Florida. Wild blueberries are primarily grown in Maine, especially along the eastern coast.
The domestic harvest season typically runs from April through September. It begins in Florida in late March, followed by Georgia in April, with peak shipments occurring between May and July.
Although official USDA production estimates for 2025 are scheduled for release in May 2026, early shipment data from USDA’s Agricultural Marketing Service show that fresh blueberry shipments declined compared to 2024. Nearly all surveyed states reported decreases, except Oregon and New Jersey.
Industry estimates from the North American Blueberry Council indicate that US highbush production in 2025 was about 9 percent lower than in 2024. However, most of this decline affected blueberries used for processing rather than those sold fresh.
Wild blueberry production in Maine experienced a much sharper drop. The 2025 crop is estimated at 45 million pounds, roughly half of the 90.8 million pounds produced in 2024. Weather played a major role, with rainy conditions disrupting pollination in the spring and early summer, followed by heat and drought later in the season.
Export trends
US blueberry exports totaled 94.8 million pounds in 2025. This represents a nine percent decline from the 2024 record of 104.3 million pounds, but still marks the second-highest export volume on record.
The decline was largely due to a sharp reduction in wild blueberry exports, which fell 46 percent to 14.4 million pounds because of lower production in Maine. In contrast, exports of cultivated blueberries increased by four percent, reaching a record 80.4 million pounds.
Organic blueberries contributed significantly to this growth. Export volumes of fresh organic cultivated blueberries rose 54 percent year over year to 13.4 million pounds, also a record high.
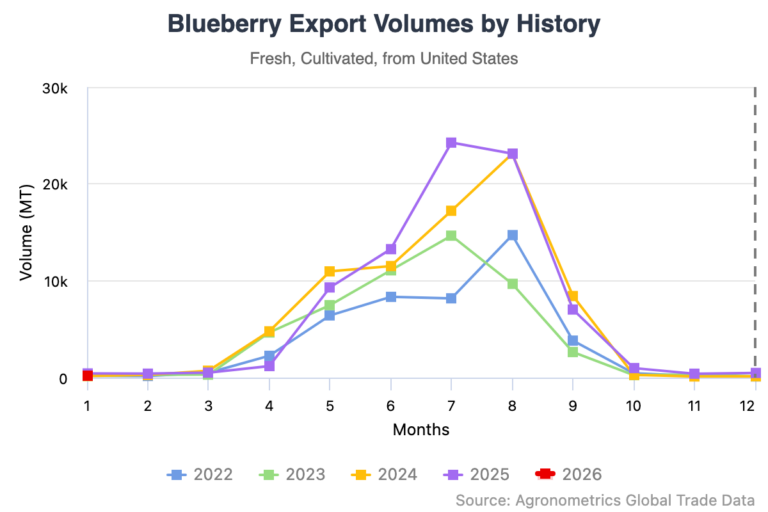
Source: USDA Market News via Agronometrics. (Agronometrics users can view this chart with live updates here)
Imports reach new highs
Imports played a dominant role in the US blueberry supply in 2025. From 2022 to 2024, imports accounted for about 65 percent of domestic availability, and that trend continued as import volumes climbed even higher.
In 2025, the United States imported 719.8 million pounds of fresh blueberries, a five percent increase from 2024 and a new record. Nearly all imports are cultivated blueberries, and volumes increased primarily due to higher shipments from Peru, Mexico, and Chile.
Imports follow a clear seasonal pattern. Mexico supplies the most US blueberries between February and May, while Peru dominates from September through February. Chile has historically been the leading exporter, but Peru surpassed it in 2019 and Mexico in 2021.
Peru has seen especially rapid growth. Between 2014 and 2016, exports to the United States averaged 15.5 million pounds annually. By 2025, Peru exported a record 405.9 million pounds, accounting for 56 percent of total U.S. blueberry imports. Production is concentrated in coastal regions such as La Libertad, Lambayeque, Áncash, and Piura.
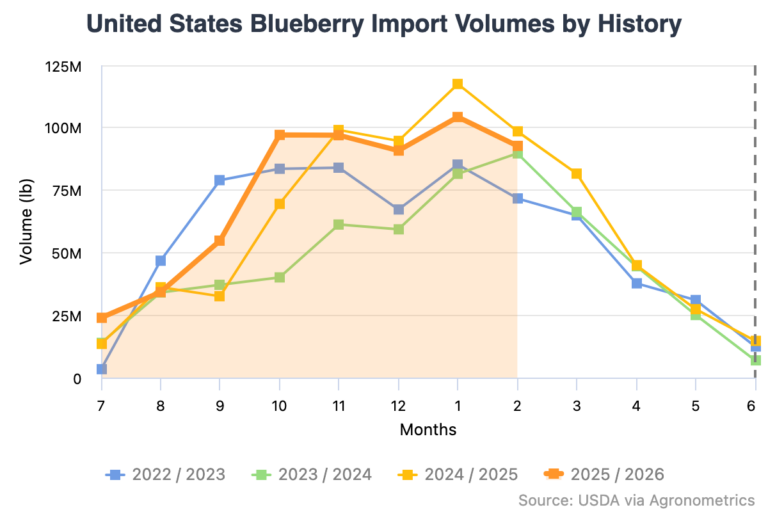
Source: USDA Market News via Agronometrics. (Agronometrics users can view this chart with live updates here)
Early 2026 market conditions
At the start of 2026, imports dominated the market even more strongly. From January through mid-March, about 99 percent of fresh blueberry shipment volume reported by the USDA came from imports.
Domestic shipments are expected to increase beginning in April and May, with the usual seasonal peak in July. However, early 2026 weather conditions may limit supply. Widespread freeze events in the Southeast are expected to reduce production in Florida and affect early-season varieties in Georgia.
Prices move higher
Prices reflected these supply dynamics. In early 2026, wholesale shipping point prices for imported conventional blueberries ranged from $28.10 to $31.15 per flat (12 one-pint containers), higher than the same period in 2025.
Retail prices also increased. In January 2026, blueberries averaged $3.21 per 6-ounce package, rising to $3.55 per 6-ounce package in February. These prices were 14 percent and 10 percent higher, respectively, than the same months a year earlier.
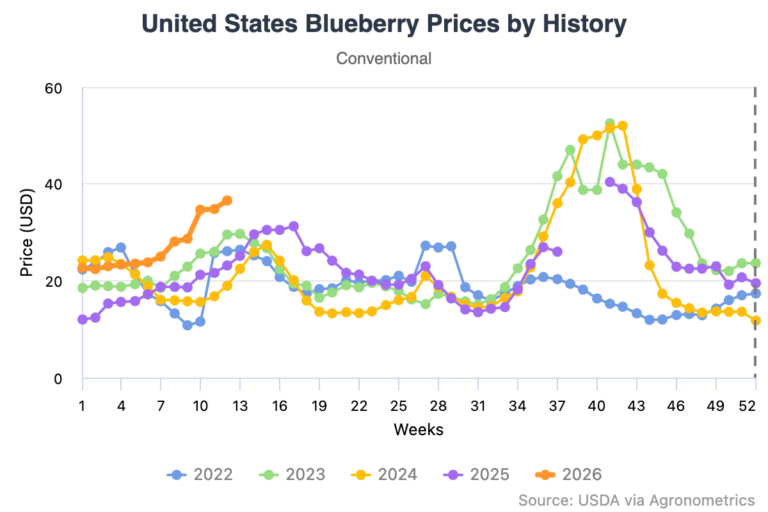
Source: USDA Market News via Agronometrics. (Agronometrics users can view this chart with live updates here)
The 2025 US blueberry market highlights a growing reliance on imports to meet demand, especially outside the domestic harvest season. While domestic production remains significant, weather challenges and shifting production patterns are affecting supply.
At the same time, countries like Peru and Mexico continue to expand their presence in the global market, ensuring a steady flow of blueberries year-round. As a result, the balance between domestic production and imports is becoming a defining feature of the US blueberry industry.
*All images are referential.
Related articles:
Agronometrics in Charts: The US blueberry boom and a look at America's most valuable fruit crop


Subscribe to our newsletter