



Agronometrics in Charts: When the model breaks: Improving real-time view of Peru’s blueberry exports
 Add Fresh Fruit Portal to Google
Each week, the series ‘Agronometrics In Charts’ examines a different horticultural commodity, focusing on a specific origin or topic and visualizing the trade market factors driving change. Check out our entire archive.
For more than a year, Agronometrics has used its Degree of Certainty (DoC) tool to estimate Peru’s blueberry exports with only a one-week delay. The result has been one of our most useful products: a timely and consistently accurate view of export volumes while official records are still evolving.
This matters especially during Peru’s peak season, when each week can shape commercial decisions across the supply chain. But real-time reporting also comes with a responsibility: when the data no longer makes sense, the model must be challenged.
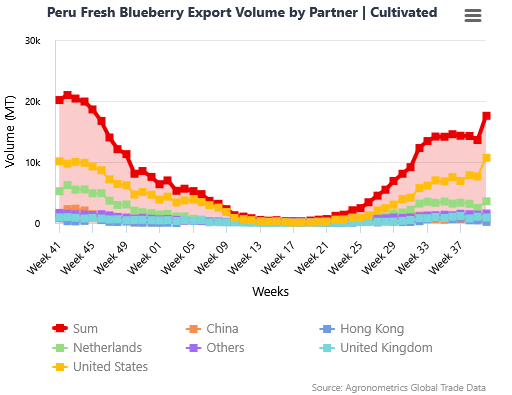
Last Monday, 5 October 2026, as the industry prepared for Fruit Attraction in Madrid and our commercial team got ready to present our latest work, our systems gave us a warning. The estimate in the chart below didn't look realistic. With a contentious Peruvian season heavily affected by El Niño at its peak, the difference was too significant to ignore. The stakes were high because the data showed an increase against the trend of steadily decreasing volume over the last couple of weeks; the question was how much higher.
Source: USDA Market News via Agronometrics.
Finding the problem in Peru's data
The first task was to determine whether the issue was in our system or in the underlying data.
After reviewing the code, diagnostics, and historical records, we found that the model was operating as designed. The DoC methodology takes a weekly snapshot of the available data and measures how it changes as additional declarations are reported and cleared. When these changes follow a consistent historical pattern, we can quantify the expected error and estimate the final reported volume before the data fully stabilizes.
For Peru, one important nuance in the dataset is when declarations are flagged as Green Channel, or cleared for export. Historically, Green Channel declarations take roughly four weeks to stabilize. Most of the revision occurs in the first week: the initial Green Channel volume has typically been about 37 percent below the final figure reported four weeks later. This relationship has remained remarkably consistent over time.
Yet the latest data clearly did not match the expected volume cleared for export. The historical pattern was intact, but the initial figures themselves were now too far from commercial reality to support a credible estimate.
A change in the reporting dynamic
We cannot say with certainty what changed. One possible explanation is that SUNAT began allowing a greater share of declarations to pass automatically through the Green Channel, or, for whatever reason, suddenly became more efficient at clearing export volumes. Regardless of the reason, if more shipments are cleared, the historical relationship between initial Green Channel records and final export volumes changes, and a model built on that relationship will no longer perform as intended.
Photo by MINAGRI.
In other words, the model had not failed because the methodology was unsound. It failed because the reporting process it was designed to measure appeared to have changed.
That distinction is important. Models should not be treated as fixed black boxes. Their value depends on continuously testing whether their underlying assumptions still hold.
Reversing the logic
Fortunately, Peru's dataset includes more than cleared Green Channel declarations. It also captures total export declarations, whether or not they have completed the clearance process. This gave us a more stable starting point.
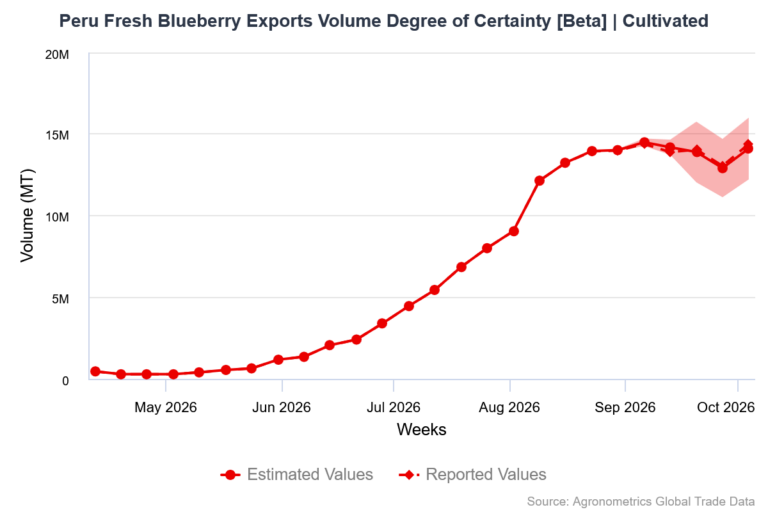
Rather than estimating final exports directly from the early Green Channel data, we reversed the logic. We began with total declarations, compared weekly snapshots against the volume eventually cleared through the Green Channel, and then blended that relationship with the confirmed Green Channel export data.
The improvement was immediate. While initial Green Channel declarations had historically been revised by around 37 percent, total declarations moved by only two to three percent on average before stabilizing over the same four-week period.
The reasoning is straightforward: fruit cannot be exported without a declaration, so this data point sets a natural limit on how much volume could possibly be exported. Once a declaration is made, the expected final export volume should stay close to that total, regardless of changes in the timing or share of shipments cleared for export.
Source: USDA Market News via Agronometrics.
Why cleared export data still matters
It would be tempting to rely solely on total declarations, but there was good reason to build the initial model on exports cleared for export. Typically, around three to six percent of declared volume is not ultimately cleared for export. At the height of Peru’s season, that difference can amount to as much as 800 MT in a single week, a meaningful volume for any producing origin, and even more when you add up a couple of weeks.
By combining the stability of total declarations with verified Green Channel records, we can retain the precision of cleared-export data while reducing the model’s exposure to changes in the clearance process.
A stronger estimate going forward
The episode was a useful reminder that real-time estimates are not simply about applying an algorithm to a dataset. They require continuous scrutiny, industry context, and the willingness to revisit a methodology when the evidence calls for it.
The revised approach uses the same underlying DoC principles but applies them more nuancedly to the data it models, reducing the influence that changes in Green Channel clearance behavior can have on the export estimate.
For users of Agronometrics’ Peru real-time export reporting, the result is a more resilient model and a more reliable early view of one of the world’s most important blueberry supply origins.
*Graphs courtesy of Agronometrics | Top image by MINAGRI, Archive.
Related stories
Peru’s Hass avocado exports set to slip as markets shift
El Niño could push Peru's agricultural export losses to $1.5B