


Avocados In Charts: Documenting the rise of Mexican avocados


In this installment of the ‘In Charts' series, Cristian Crespo of Agronometrics illustrates how the U.S. market is evolving. Each week the series looks at a different horticultural commodity, focusing on a specific origin or topic visualizing the market factors that are driving change.


Of all of the exports that have entered into the U.S. market in the past 20 years, avocados have definitely made the biggest splash. And of those avocado exporters, Mexico has pulled ahead as the clear winner in the market.
Shown below is the incremental rise of Mexican avocado exports across time. Mexican avocados entry into the market had huge ripple effects for the entire market. In particular, avocados have done well during the week of the Super Bowl and during that time, avocados - mainly made into guacamole - have been bought in greater numbers.
Volumes (kg) of avocados in the U.S. 2000-2020
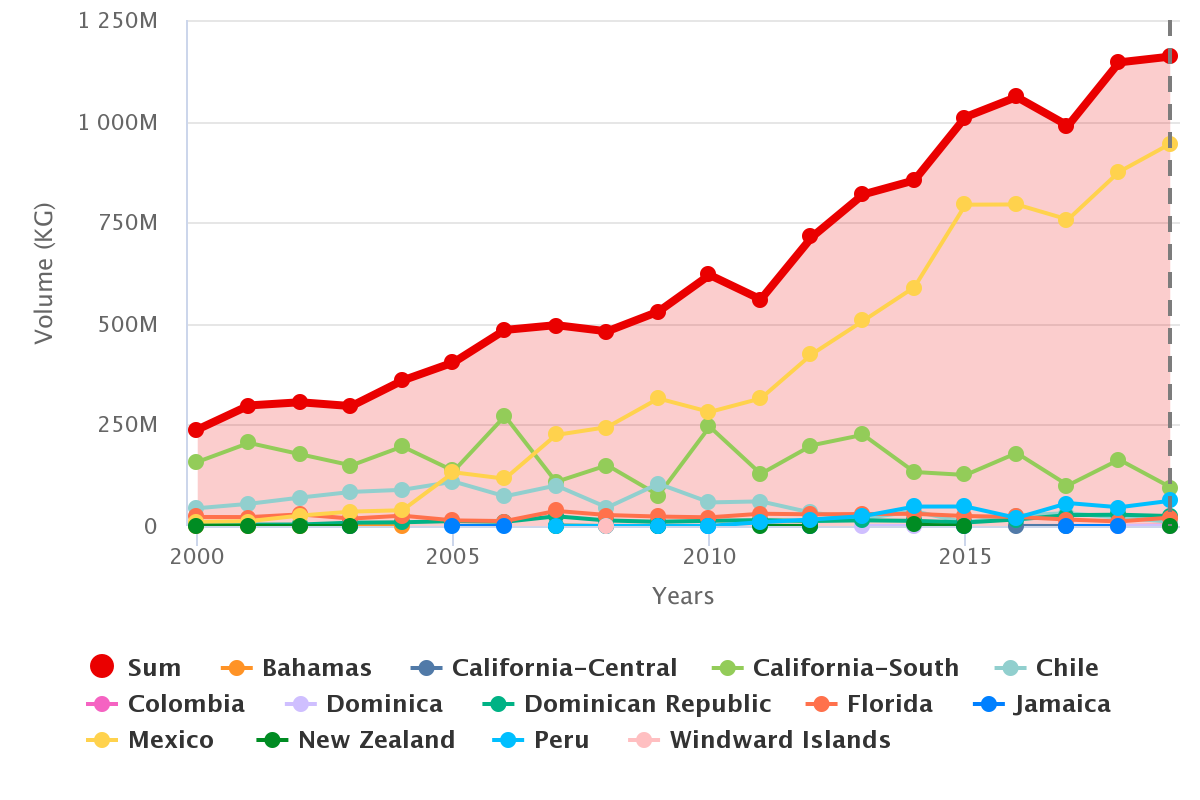 (Source: USDA Market News via Agronometric. View this chart with live updates here)
The Super Bowl is the most viewed sports event worldwide, surpassing even the soccer world cup. And because of the event's popularity, exports of avocados to the U.S. heat up in the days leading up to the game.
Volumes (kg) of Mexican avocados in the U.S. 2000-2020
(Source: USDA Market News via Agronometrics. View this chart with live updates here)
The above chart shows the progression of Mexico's avocados in the U.S. in both volumes sent and prices. Mexican avocado prices typically set the standards for the average price of avocados in the market more generally. This is especially notable after 2007 when Mexico became the most important exporters to the U.S.
Prices reflect the fact that avocados from the country have also improved across time.
Average price of Mexican avocados in the U.S. (USD/kg) 2000-2020
(Source: USDA Market News via Agronometrics. View this chart with live updates here)
Mexican avocado exports continue to increase and saw big volumes last year.
"In 2019, Mexican avocado producers - the country that accounts for 80% of all avocados consumed in the U.S. - sent record volumes to the market, reaching 120,000 metric tons (MT). This number is 20,000MT more than in 2018 and to fulfill that demand, it means that every eight minutes, a truck full of Mexican avocados is sent out of Michoacan."
In our ‘In Charts’ series, we work to tell some of the stories that are moving the industry. Feel free to take a look at the other articles by clicking here.
You can keep track of the markets daily through Agronometrics, a data visualization tool built to help the industry make sense of the huge amounts of data that professionals need to access to make informed decisions. If you found the information and the charts from this article useful, feel free to visit us at www.agronometrics.com where you can easily access these same graphs, or explore the other 20 fruits we currently track.


Subscribe to our newsletter


