


Agronometrics in Charts: IBO releases the blueberry data for the Americas


In this installment of the ‘Agronometrics In Charts’ series, Colin Fain illustrates how the U.S. market is evolving. Each week the series looks at a different horticultural commodity, focusing on a specific origin or topic visualizing the market factors that are driving change.


The International Blueberry Organization (IBO) recently launched the newest iteration of the State of the Industry Report, a publication with a rich 20-year history highlighting the most important blueberry trends.
The 2020 report builds on this legacy, modernizing the report in an all-digital format that is being made for the first time free to the public. Visit the report with the following link: https://report.internationalblueberry.org
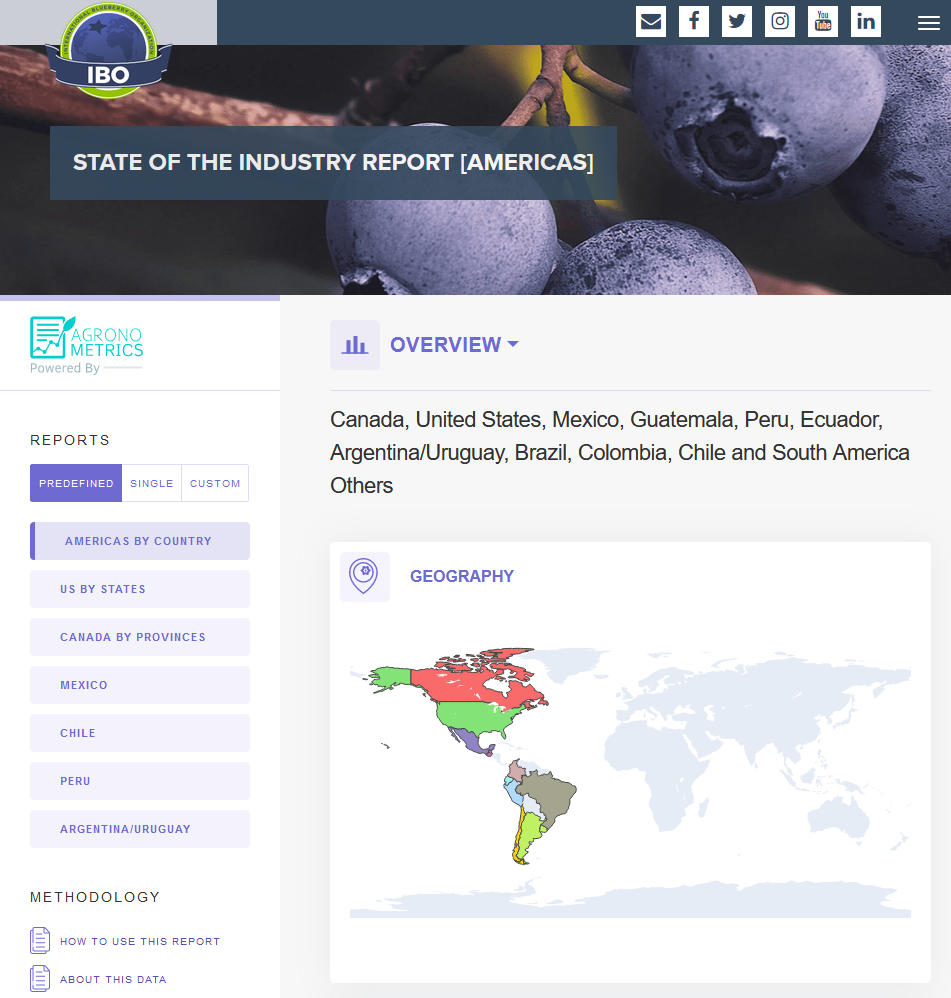
This Special Edition focused on the Americas is being published in response to the uncertainty and need for accurate data since the US International Trade Center’s (USITC) investigation into blueberries imports, which carries with it the possibility of imposing a “trade remedy” to restrict imports in order to protect US production. The report, which Agronometrics helped create, is an impartial tool built from member provided data.
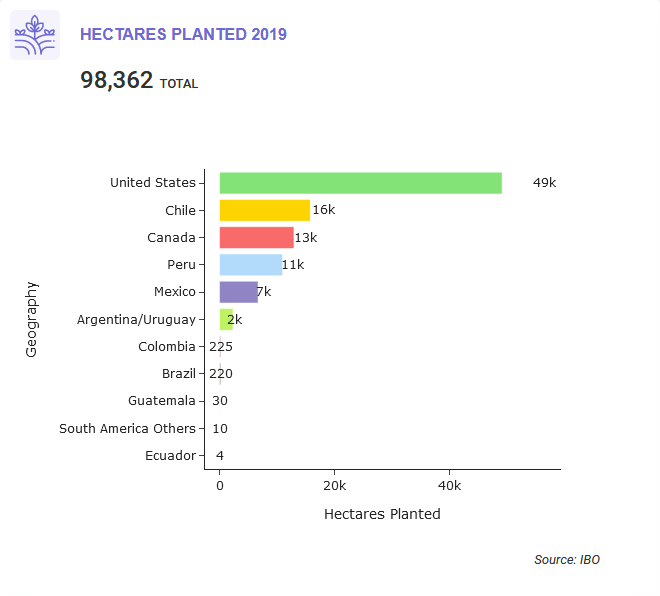
The report offers the most complete accounting of hectares planted and production statistics available anywhere, with information on fresh as well as processed blueberries and complemented by calculated yields, production trends, import data, export data and utilization.
Custom Navigation
An innovative functionality of this year's State of the Industry Report is the ability to compare any producing region to each other through custom navigations. This feature allows for a better understanding of the markets and how all the different producing regions work together to supply consumers within the region and beyond.
Production Fresh Total (Metric Tons)

(Source: IBO)
In our ‘In Charts’ series, we work to tell some of the stories that are moving the industry. Feel free to take a look at the other articles by clicking here.
You can keep track of the markets daily through Agronometrics, a data visualization tool built to help the industry make sense of the huge amounts of data that professionals need to access to make informed decisions. If you found the information and the charts from this article useful, feel free to visit us at www.agronometrics.com where you can easily access these same graphs, or explore the other 20 fruits we currently track.


Subscribe to our newsletter


