


Agronometrics in Charts: Price update for berries in the U.S. market


In this installment of the ‘In Charts' series, Cristian Crespo of Agronometrics illustrates how the U.S. market is evolving. Each week the series looks at a different horticultural commodity, focusing on a specific origin or topic visualizing the market factors that are driving change.


This week we’re going to look at how prices of blueberries, raspberries, strawberries and blackberries have been behaving in the U.S. market in comparison with previous seasons.
Blueberries
Beginning with blueberries, Peruvian blueberry imports have been higher than in 2019, which could be a reason for low prices.
We will continue to observe how the North American market reacts when large volumes of blueberries from Chile begin to arrive.
In relation to the price of blueberries, they have been similar to those of last year, although during weeks 43 to 48 of this year, they showed a significant decrease compared to the same weeks in 2019.
Looking at the graph below, we can see that in week 48, the average price of conventional blueberries was $5.33 per kilo, a 24 percent decrease year-on-year. The average prices were $6.97 per kilo in 2019. Volumes are coming from Mexico.
Price of non-organic blueberries in the U.S. market (USD per kilo)

(Source: USDA Market News via Agronometrics) [Agronometrics users can view this chart with live updates here]
Raspberries
Continuing, raspberries have experienced sharp ups and downs throughout this year, showing higher prices in week 41 year-on-year.
As can be seen from the graph below, in week 48 average prices of conventional raspberries were $5.88 per kilo, which is a 17 percent increase year-on-year, as the average prices were $5.02 per kilo in 2019.
The U.S. market is being supplied by California and Mexico.
Price of non-organic raspberries in the U.S. market (USD per kilo)
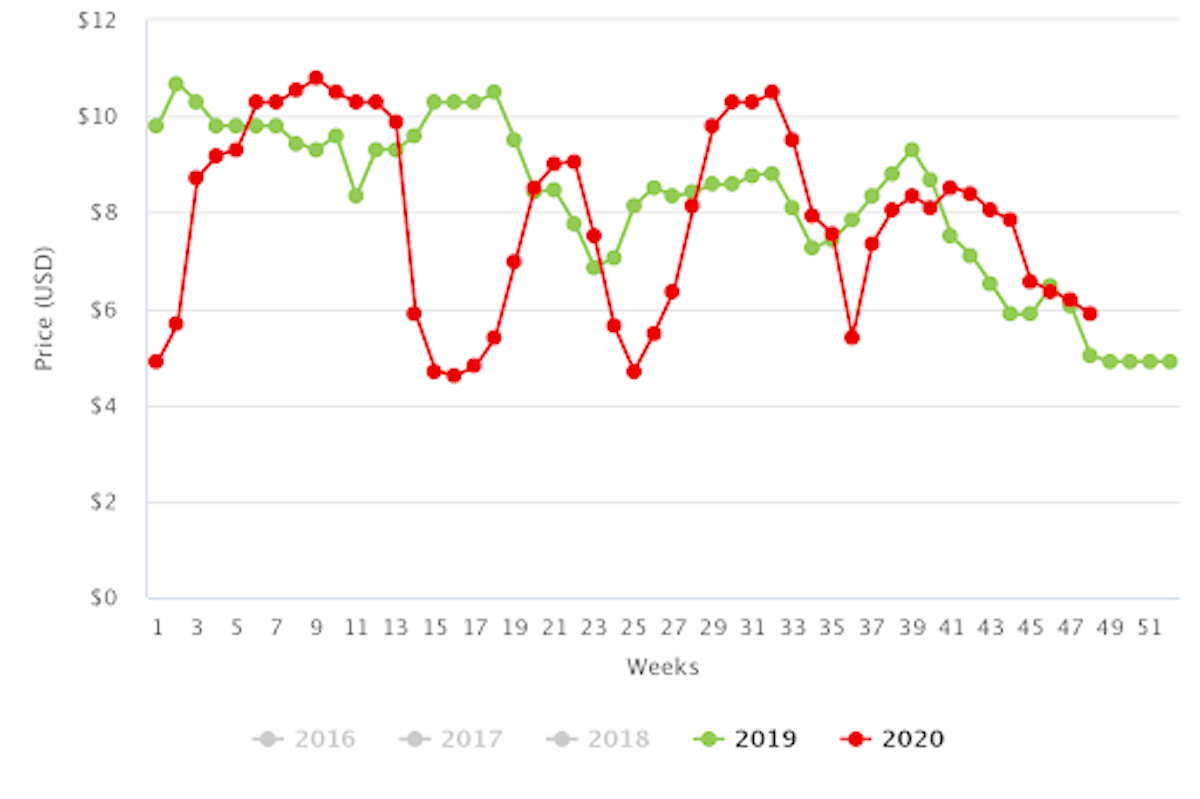
(Source: USDA Market News via Agronometrics) [Agronometrics users can view this chart with live updates here]
Strawberries
The prices of non-organic strawberries over recent weeks, starting in week 38, have been slightly higher year-on-year, although with some significant fluctuations.
As we can see from the graph below, in week 48, average prices were down five percent year-on-year at $4.77 per kilo. In 2019 the average prices were $5.03 per kilo, with fruit being supplied by California, Florida and Mexico.
Price of non-organic strawberries in the U.S. market (USD per kilo)

(Source: USDA Market News via Agronometrics) [Agronometrics users can view this chart with live updates here]
Blackberries
The prices of blackberries in 2020, especially in week 41, have been lower than those in 2019.
In week 48, the average prices of conventional blackberries were $5.51 per kilo, a 23 percent decrease year-on-year. The average prices last year were $7.15 per kilo.
The supply of blackberries is coming from California and Mexico.
Price of non-organic blackberries in the U.S. market (USD per kilo)

(Source: USDA Market News via Agronometrics) [Agronometrics users can view this chart with live updates here]
In our ‘In Charts’ series, we work to tell some of the stories that are moving the industry. Feel free to take a look at the other articles by clicking here.
You can keep track of the markets daily through Agronometrics, a data visualization tool built to help the industry make sense of the huge amounts of data that professionals need to access to make informed decisions. If you found the information and the charts from this article useful, feel free to visit us at www.agronometrics.com where you can easily access these same graphs, or explore the other 20 fruits we currently track.


Subscribe to our newsletter


