


Agronometrics in Charts: Low California and Chilean kiwifruit supplies lead to high prices


In this installment of the ‘Agronometrics In Charts’ series, Cristian Crespo F. illustrates how the U.S. market is evolving. Each week the series looks at a different horticultural commodity, focusing on a specific origin or topic visualizing the market factors that are driving change.


This week we will take a look at prices and volumes of kiwifruit in the U.S. market. During the end of last year and the first few months of 2021, the average shipping point prices have been far higher than in previous years.
This is likely due to lower supplies in the market, principally from California and Chile, the latter of which saw a drop in production stemming from the lack of labor availability during the Covid-19 pandemic. The increased demand for products high in vitamin C could also be behind the price rise.
The average price in April reached US$25.04 per 9kg (19.8lb) container, which is 60 percent higher year-on-year.
Historical prices of kiwifruit (USD/KG)

(Source: USDA Market News via Agronometrics. Agronometrics users can view this chart with live updates here)
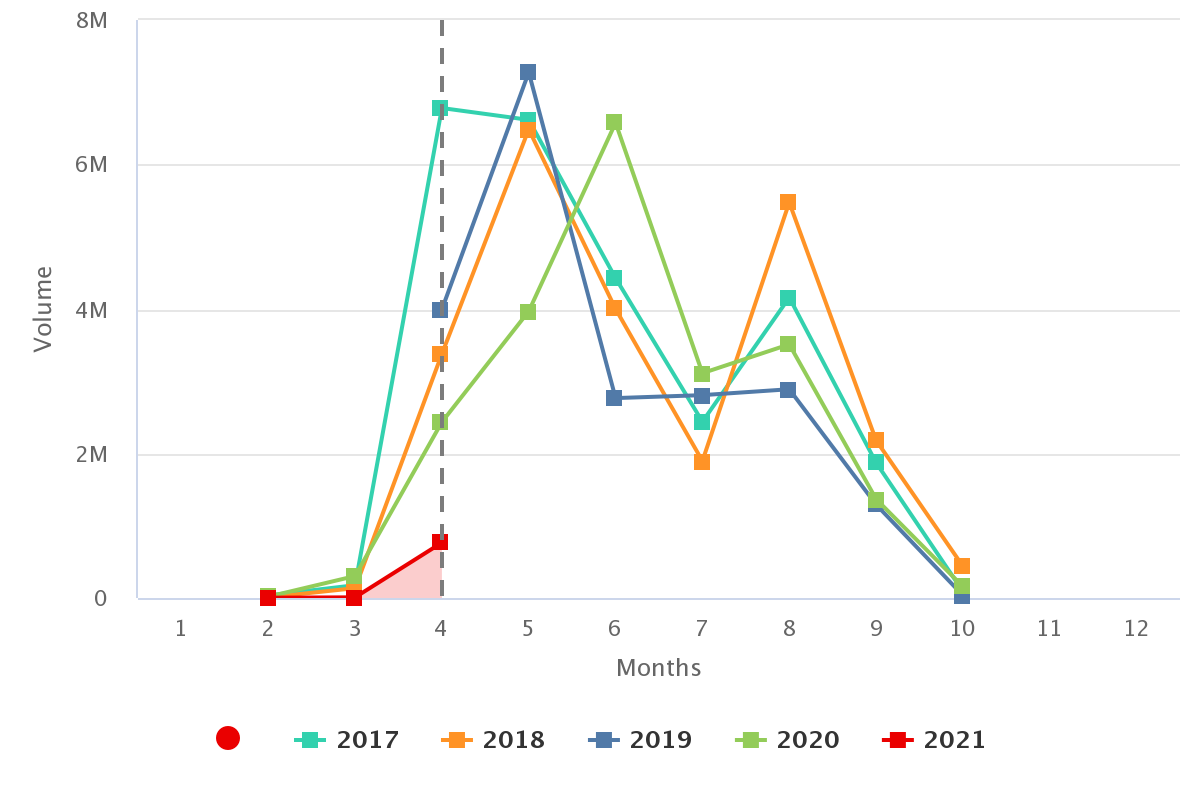
The decrease in volumes has been equally significant, as can be seen below.
In April 2021, supplies in the U.S. market were down by 31 percent year-on-year 5.5 million kilograms.
Volumes of kiwifruit in the U.S. market (KG)

(Source: USDA Market News via Agronometrics. Agronometrics users can view this chart with live updates here)
In April 2021, volumes from Chile in the U.S. were a whole 69 percent lower year-on-year at 766,584 kilograms.
Kiwifruit volumes from Chile (KG)
(Source: USDA Market News via Agronometrics. Agronometrics users can view this chart with live updates here)
Meanwhile, in the same month volumes from California were down by 68 percent, at 294,840 kilograms.
Kiwifruit volumes from California (KG)

(Source: USDA Market News via Agronometrics. Agronometrics users can view this chart with live updates here)
In our ‘In Charts’ series, we work to tell some of the stories that are moving the industry. Feel free to take a look at the other articles by clicking here.
You can keep track of the markets daily through Agronometrics, a data visualization tool built to help the industry make sense of the huge amounts of data that professionals need to access to make informed decisions. If you found the information and the charts from this article useful, feel free to visit us at www.agronometrics.com where you can easily access these same graphs, or explore the other 20 fruits we currently track.


Subscribe to our newsletter


