


Agronometrics in Charts: Best pricing scenarios of avocado in the U.S. market


In this installment of the ‘Agronometrics In Charts’ series, Cristian Crespo F. illustrates how the U.S. market is evolving. Each week the series looks at a different horticultural commodity, focusing on a specific origin or topic visualizing the market factors that are driving change.


In this week's "In Charts", we'll take a tour of avocado prices and volumes in the North American market.
Avocados in the U.S. market began with prices lower this year than in 2020. The price of avocados began to rise and from week 11 until week 26, slightly exceeding reported prices year on year.
The rise was produced by the large volumes of the fruit that arrived from Mexico as you will see in a later graph.
As of week 27, avocado prices (USD/KG) began to see a significant increase year on year, staying on trend until last week, or week 31.
If we look at the graph below, we can see that in week 31, the price of avocados in the North American market was around $3.02 per kilogram, representing a 22 percent increase year on year.
Prices of avocados in the North American market (USD/KG) 

(Source: USDA Market News via Agronometrics) [Agronometrics users can view this chart with live updates here]
Currently, the average prices are mainly made up of those from the Hass variety, whose volumes are from California, Mexico and Peru as shown in the graph below.
It is also worth noting, according to the graph is that avocados from California have the best average prices in the U.S. market.
Hass avocado prices in the U.S. market by origin (USD/KG)
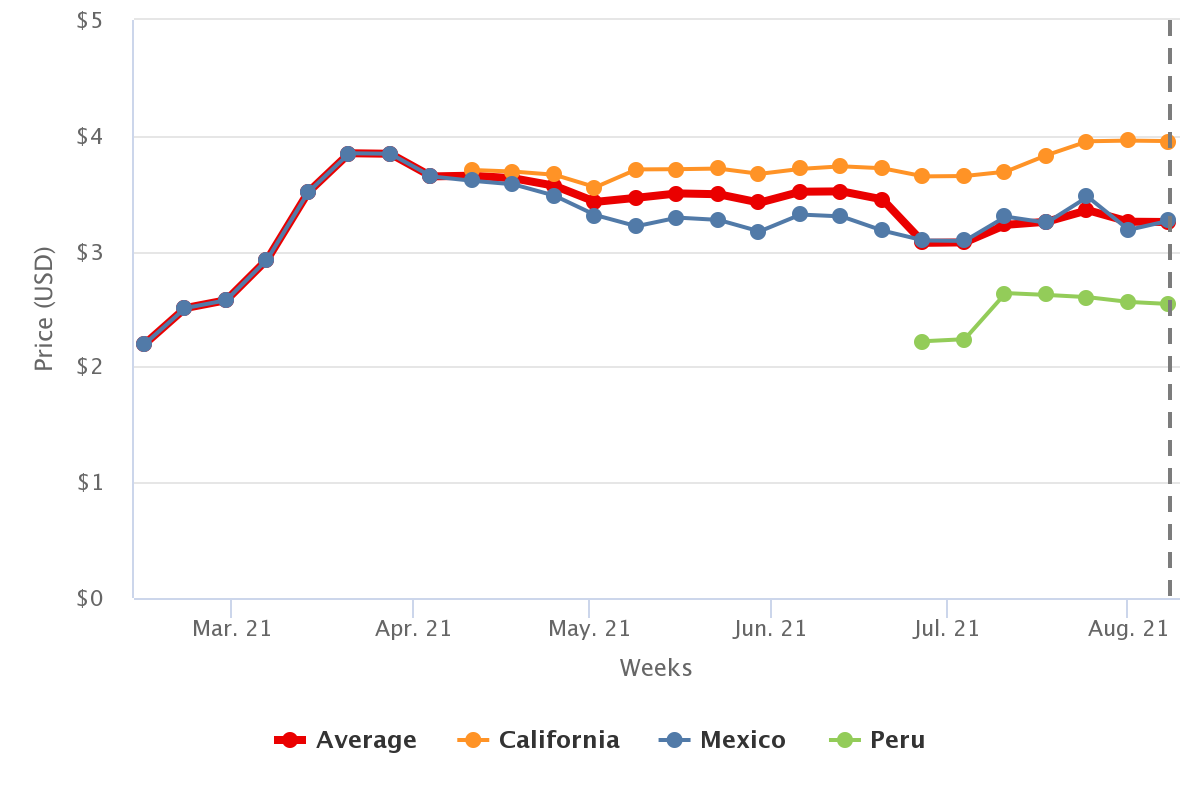
(Source: USDA Market News via Agronometrics) [Agronometrics users can view this chart with live updates here]
This price increase happened despite high volumes arriving in the U.S. market in July, as can be seen in the following graph.
Monthly volume of avocados (KG) in the U.S. market

(Source: USDA Market News via Agronometrics) [Agronometrics users can view this chart with live updates here]
If we do a weekly breakdown, we can see in the graph below that these volumes decreased from week 25, with a rise in week 28 and proceeded to decrease again, mainly those from Southern California.
Weekly volume of avocados (KG) in the U.S. market

In our ‘In Charts’ series, we work to tell some of the stories that are moving the industry. Feel free to take a look at the other articles by clicking here.
You can keep track of the markets daily through Agronometrics, a data visualization tool built to help the industry make sense of the huge amounts of data that professionals need to access to make informed decisions. If you found the information and the charts from this article useful, feel free to visit us at www.agronometrics.com where you can easily access these same graphs, or explore the other 20 fruits we currently track.


Subscribe to our newsletter


