


Agronometrics in Charts: Asparagus prices rising in U.S. market


In this installment of the ‘In Charts' series, Cristian Crespo of Agronometrics illustrates how the U.S. market is evolving. Each week the series looks at a different horticultural commodity, focusing on a specific origin or topic visualizing the market factors that are driving change.


In this week's edition, we will look into the average prices and volumes of asparagus in the U.S. market and how they have been behaving, specifically by varieties and origin.
Average prices of asparagus in the U.S. market this year have followed the regular curve of other years, with prices higher or lower than last year depending on the weeks in which they were recorded. As of week 35, and until now in week 37, prices have broken with the regular trend of last year and are trending higher. It should be noted that on average, prices in 2021 have been below those of last year.
As can be seen in the graph below, asparagus prices in week 37 were US$5.70 per kilogram, a 73 percent increase year on year.
Average asparagus prices in the U.S. market (USD/KG)
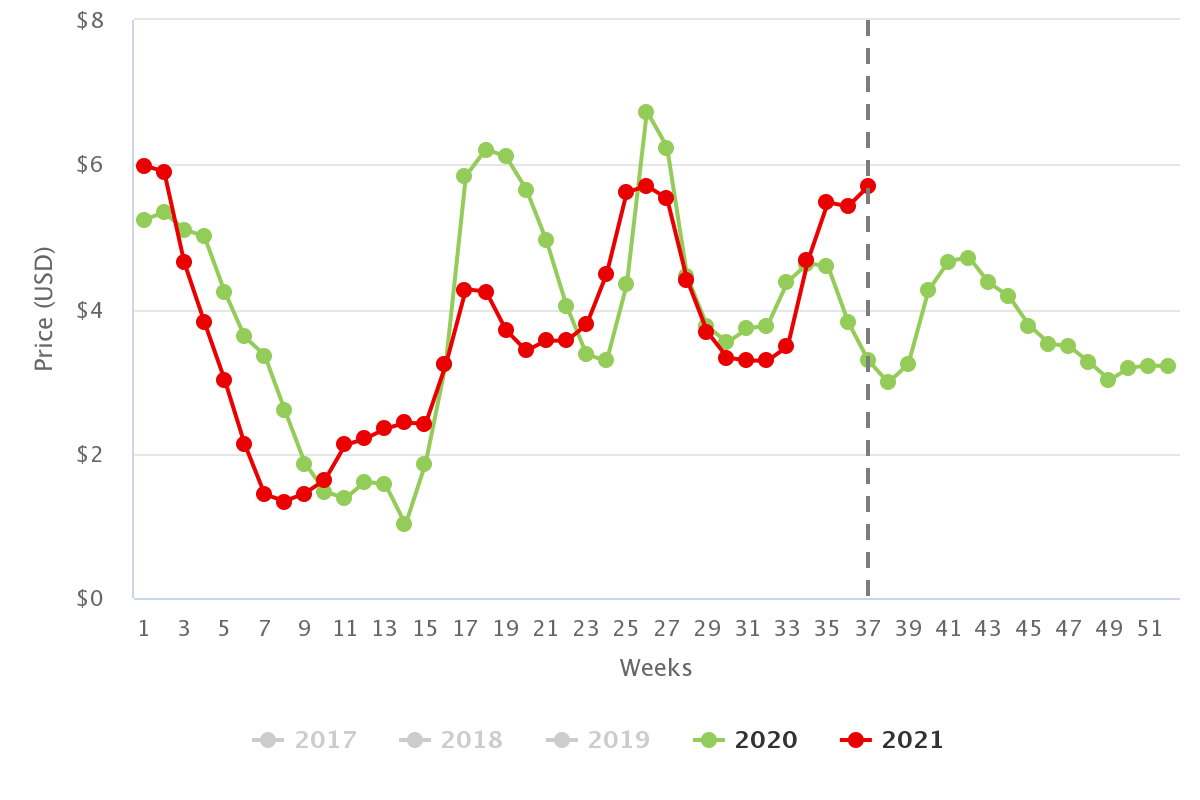
(Source: USDA Market News via Agronometrics) [Agronometrics users can view this chart with live updates here]
Regarding the average prices of asparagus according to variety, we can see that in week 37 prices for the "green" variety were US$5.86 per kilogram which is a 49 percent increase year on year. On the other hand, in week 37, the average prices of the "white" variety were US$4.96 per kilogram which is 39 percent higher year on year.
The curious thing that should be highlighted is that the average prices of the "white" variety remained well above the "green" variety throughout the year, except in the last three weeks as we can see in the graph below.
Average asparagus prices in the U.S. market, by variety (USD/KG)
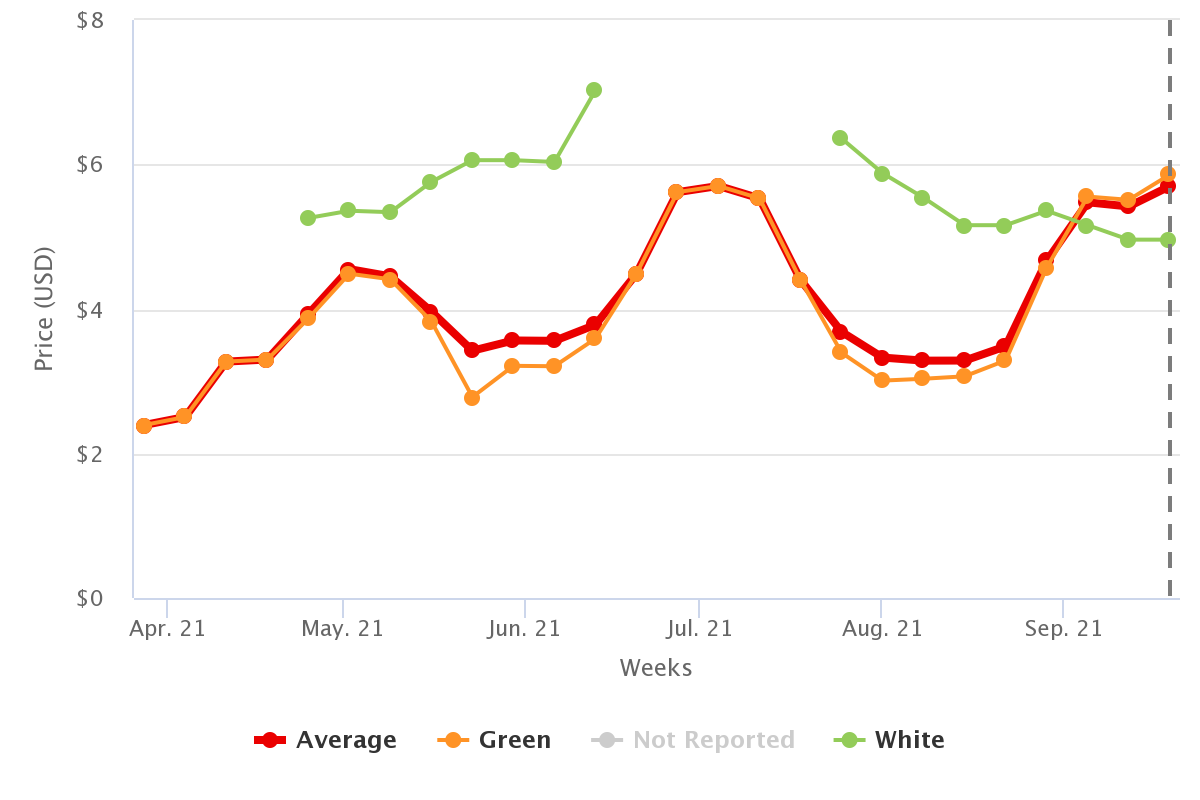
(Source: USDA Market News via Agronometrics) [Agronometrics users can view this chart with live updates here]
Over the last few weeks, lower volumes of the vegetable have been received compared to last year, both from Mexico and Peru, which could explain the reason for the price increase in these weeks year on year.
Weekly volumes of asparagus in the U.S. market (KG)
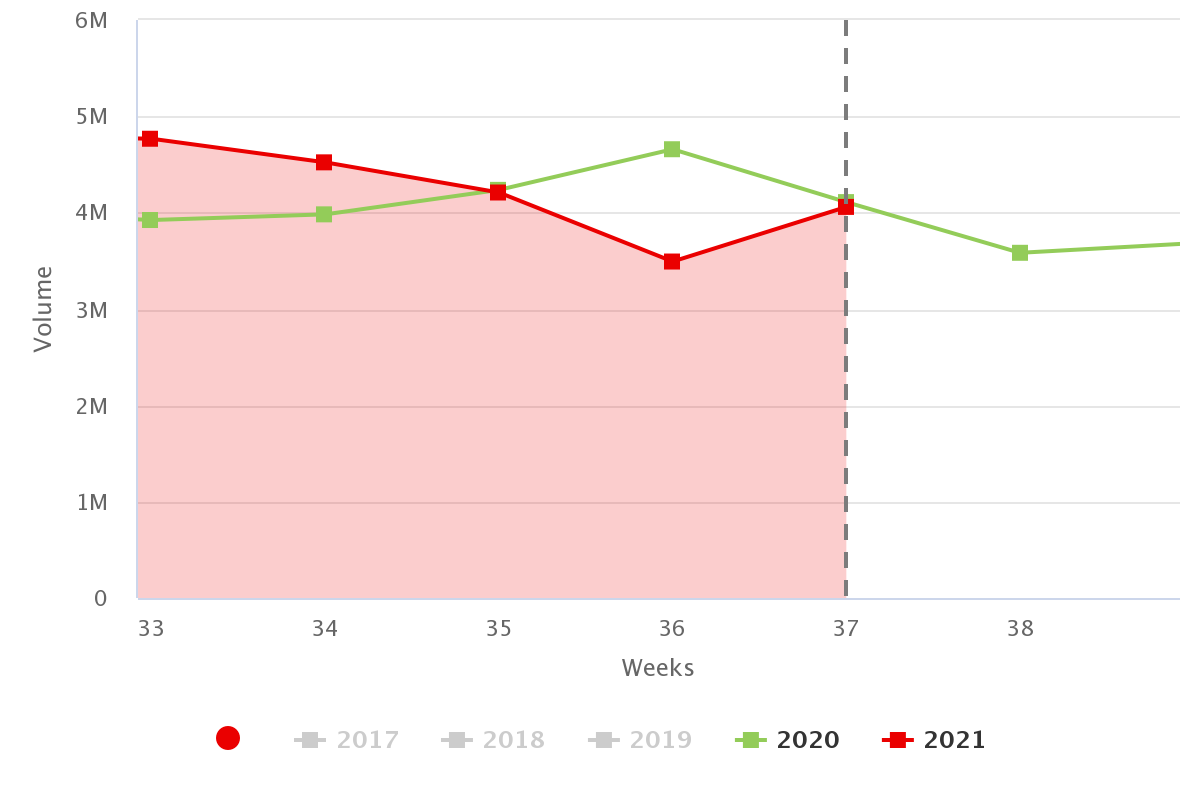
(Source: USDA Market News via Agronometrics) [Agronometrics users can view this chart with live updates here]
However, looking at the monthly cumulative volumes of asparagus, we can see that these have been the highest of the last five years in the North American market, shown in the graph below. This would explain why the average prices of this year have been lower than those recorded in 2020.
Cumulative volumes of asparagus in the U.S. market (KG)

(Source: USDA Market News via Agronometrics) [Agronometrics users can view this chart with live updates here]
This increase in asparagus volumes in the U.S. market has been mainly due to increased supplies from Peru and Mexico, the latter still being the main supplier of the vegetable to the North American market. Mexican production of asparagus has reached 301,000 metric tons during 2021, showing more than a 10 percent increase year on year.
In our ‘In Charts’ series, we work to tell some of the stories that are moving the industry. Feel free to take a look at the other articles by clicking here.
You can keep track of the markets daily through Agronometrics, a data visualization tool built to help the industry make sense of the huge amounts of data that professionals need to access to make informed decisions. If you found the information and the charts from this article useful, feel free to visit us at www.agronometrics.com where you can easily access these same graphs, or explore the other 20 fruits we currently track.


Subscribe to our newsletter


