


Agronometrics in Charts: Mango varieties see mixed prices in U.S. market


In this installment of the ‘In Charts' series, Cristian Crespo of Agronometrics illustrates how the U.S. market is evolving. Each week the series looks at a different horticultural commodity, focusing on a specific origin or topic visualizing the market factors that are driving change.


This week for In Charts, we will talk about the U.S. mango market and look at how prices of the main varieties and origins behaved during the recently ended season, the weeks that reached the highest prices and the window that North America has before the next season begins.
In the graph below we can see that between 2020 and 2021, mango prices of the main varieties behaved similarly across the board in the U.S. market. As was mentioned in previous articles, the highest average prices are from Haiti's premium mango variety called Francis.
The highest prices per kilogram this season were for the Francis variety at US$2.82 per kilogram in the week of April 11, more than 11 percent higher than the highest price of 2020.
The lowest prices were for the Keitt variety with $0.69 per kilogram in the week of August 8 this year, which is a 15 percent drop from the lowest price last year.
The highest average prices of the Ataulfo variety were around $2.14 per kilogram during the week of Feb. 7, showing a two percent decrease from the highest price of 2020. The overall average prices of this variety during 2021 were higher than those of 2020.
Regarding the Tommy Atkins variety, the average prices for 2021 were slightly higher than in 2020. However, in the week of Sept. 5, the highest prices reached were 12 percent lower than the highest prices of last year at $1.60 per kilogram.
The main varieties of mangoes that reach the U.S. market, together with Francis are Ataulfo, Keitt, Kent and Tommy Atkins.
Mango prices in the U.S. market, by variety (USD/KG)

(Source: USDA Market News via Agronometrics) [Agronometrics users can view this chart with live updates here]
We can see from the following graph that the U.S. market is mainly dominated by the Tommy Atkins variety, which is the one that sets the foundation of average mango prices for much of the year, as well as being the only variety that is present throughout the calendar year.
October has been the only month that is seeing above-average prices, as there was a decrease from May to June.
Average prices of Tommy Atkins mangos in the U.S. market (USD/KG)

(Source: USDA Market News via Agronometrics) [Agronometrics users can view this chart with live updates here]
In the graph below we can see the window that happens due to the decrease of large mango volumes from Mexico. High prices typically occur in the window that is supplied mainly by mangos from Brazil, Ecuador and Peru, so we will be closely monitoring production in these countries to see how future volumes affect prices in the North American market.
Mango volumes in the U.S. market (KG)
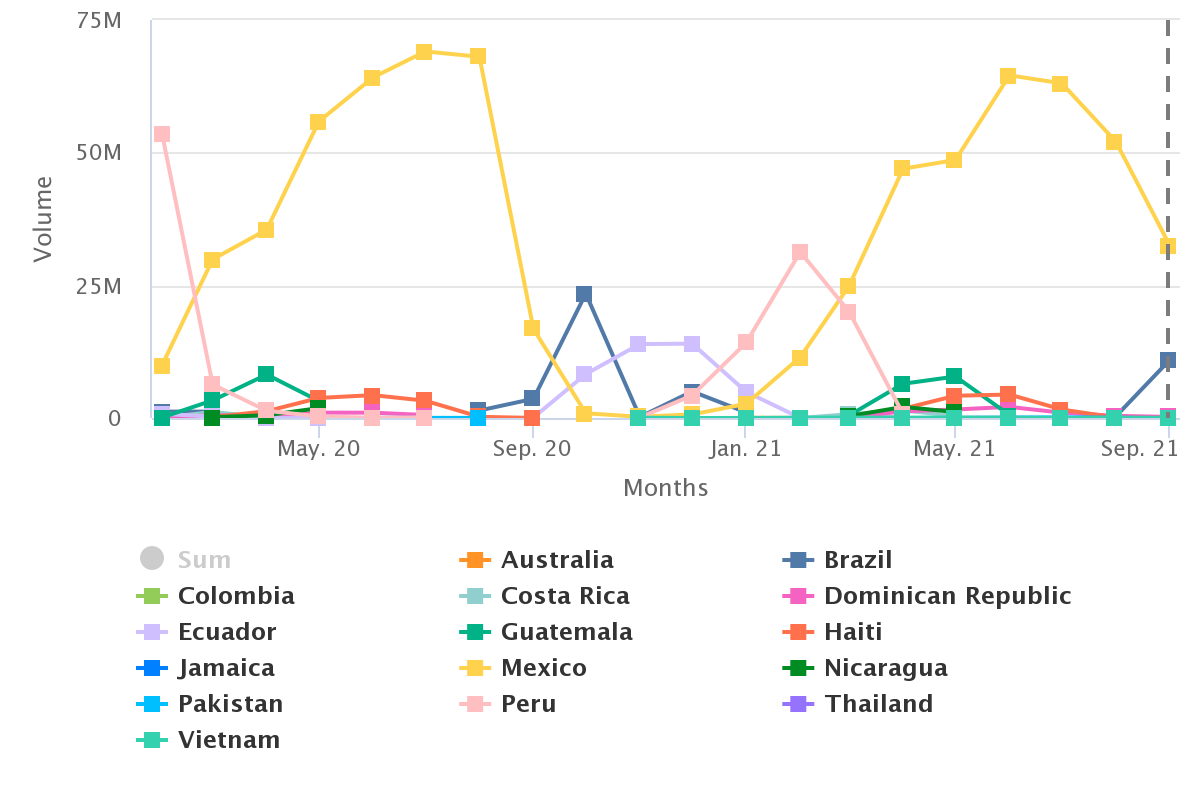
(Source: USDA Market News via Agronometrics) [Agronometrics users can view this chart with live updates here]
In our ‘In Charts’ series, we work to tell some of the stories that are moving the industry. Feel free to take a look at the other articles by clicking here.
All pricing is for domestic US produce, representing the spot market at Shipping Point (i.e. packing house/climate-controlled warehouse, etc.). For imported fruit, the pricing data represents the spot market at Port of Entry.
You can keep track of the markets daily through Agronometrics, a data visualization tool built to help the industry make sense of the huge amounts of data that professionals need to access to make informed decisions. If you found the information and the charts from this article useful, feel free to visit us at www.agronometrics.com where you can easily access these same graphs, or explore the other 20 fruits we currently track.


Subscribe to our newsletter