


Agronometrics in Charts: Strawberry prices and volumes in the U.S. market


In this installment of the ‘Agronometrics In Charts’ series, Cristian Crespo F. illustrates how the U.S. market is evolving. Each week the series looks at a different horticultural commodity, focusing on a specific origin or topic visualizing the market factors that are driving change.


In this week's article of our series "Agronometrics in Charts", we will take a tour of prices and volumes of strawberries in the United States market.
Strawberry prices during this year have been different than the previous year's pricing curve, with high prices between weeks 13 and 18 compared to the year 2020. Prices were lower between weeks 26 and 32 and between weeks 37 to 42 showing sensitivity to low volumes, compared to the previous year, as was explored in a previous article of agronometrics in charts.
The graph below shows that average prices for conventional strawberries in the U.S. market were US$6.70 per kilogram, a 34 percent increase year-on-year. The prices that are being registered are those of fruit arriving from California and Mexico.
Strawberry prices in the U.S. market (USD/KG)
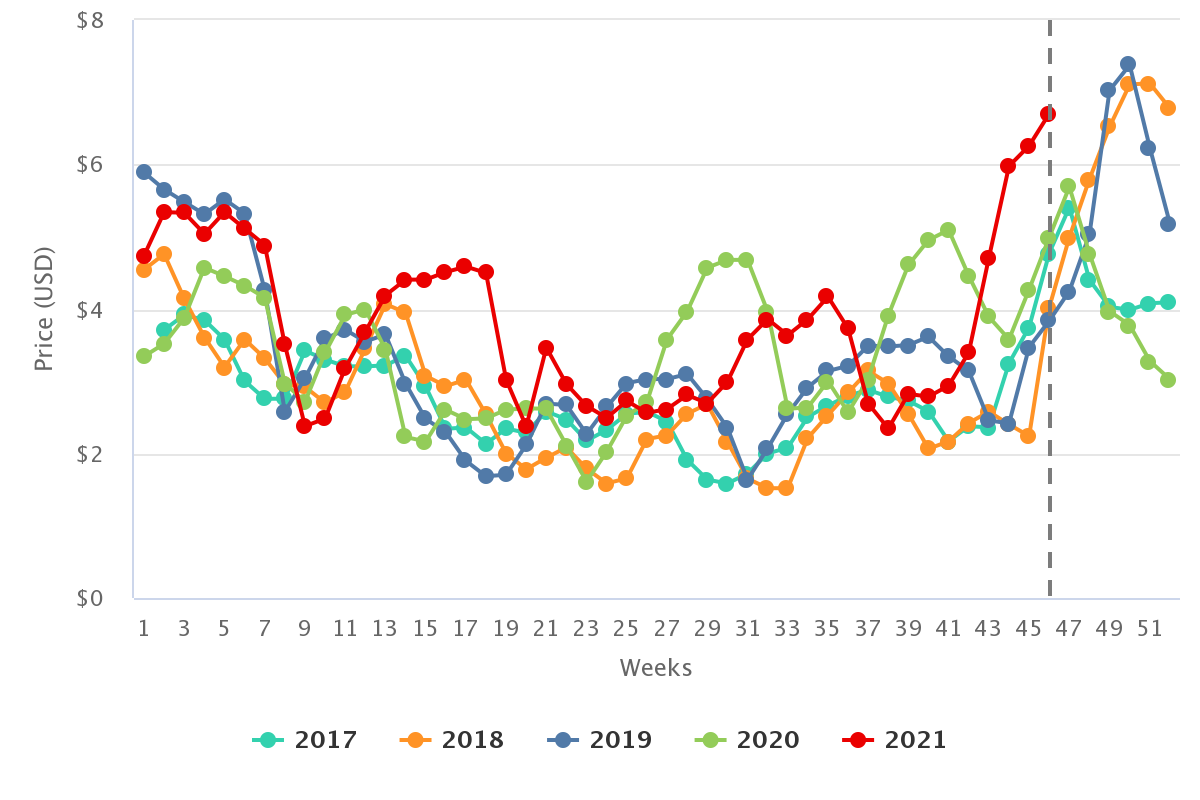
(Source: USDA Market News via Agronometrics) [Agronometrics users can view this chart with live updates here]
In relation to the volumes of strawberries arriving in the U.S. market, we can see in the graph below, that these have been constantly decreasing since week 26, but maintaining a behavior similar to that of the previous year.
In recent weeks of this year, strawberry volumes have been down year-on-year, mainly those from Central California and Mexico. All this may have been an influence of the price increase of strawberries in recent weeks.
Weekly volumes of strawberries in the U.S. market (KG)

(Source: USDA Market News via Agronometrics) [Agronometrics users can view this chart with live updates here]
We will be very closely monitoring what happens with strawberry prices now that there are greater volumes from Mexico, as Mexico is the second-largest supplier of strawberries in the U.S. market, after California.
To end, we want to present a graph that shows the main, and almost unique, form of transportation for strawberry arrivals in the U.S. market is through trucks.
Volumes of strawberries in the U.S. market (KG)

(Source: USDA Market News via Agronometrics) [Agronometrics users can view this chart with live updates here]
In our ‘In Charts’ series, we work to tell some of the stories that are moving the industry. Feel free to take a look at the other articles by clicking here.
You can keep track of the markets daily through Agronometrics, a data visualization tool built to help the industry make sense of the huge amounts of data that professionals need to access to make informed decisions. If you found the information and the charts from this article useful, feel free to visit us at www.agronometrics.com where you can easily access these same graphs, or explore the other 20 fruits we currently track.


Subscribe to our newsletter


