

In this installment of the ‘Agronometrics In Charts’ series, Sarah Ilyas studies the progression of Mexico’s grape season. Each week the series looks at a different horticultural commodity, focusing on a specific origin or topic visualizing the market factors that are driving change.
In March 2022, AALPUM (Mexico’s Sonora Table Grape Growers Association) came up with a harvest estimate of 25 million boxes for the current season. Recently, however, it deems it reasonable to expect a very similar total volume to 2021 which stood at 21.3 million boxes.
In May, movement was impacted by supply-chain constraints, by a growing presence of Chilean table grapes in the USA & Canada, as well as a flourishing market in Mexico which left most of the fruit within the country.
Additionally, production and markets were impacted by the challenges of a tight labor market which led to tough decisions. "This change is largely driven by two key factors," says John Pandol, director of Pandol Bros' Special Projects and current president of the grape division of the Fresh Products Association of the Americas.
"The first factor is that retailers didn't rush to be the first to market in new areas; they marketed well-ripe late-season grapes from the previous origin. The other factor is that there was a reduction of early season varieties, such as Perlettes and Flames, and the limitation of new varieties to replace them," he said.
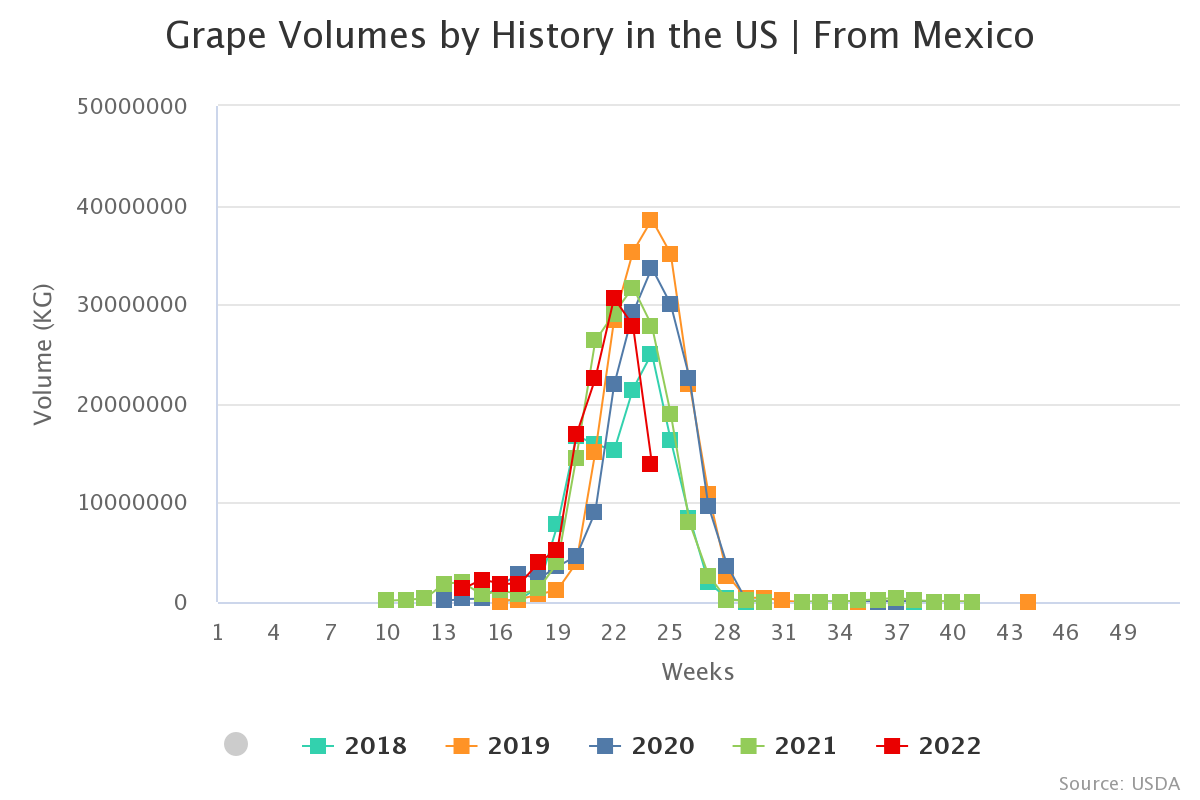
Volumes in week 24 stood at 14 K tonnes, a 50 percent drop compared to the previous season which saw volumes as high as 27 K tonnes in week 24.

Traditional and conventional varieties had more of a medium size, such as Flame Seedless in May 2022, while patented varieties remained large to extra-large.
According to Miguel Suarez of grape and melon marketer Mas Melones & Grapes, the dynamics of the season and spread of varieties started to take shape about five years ago, with the arrival of varieties like Sweet Globe and Sweet Celebrations.
Suarez also believes that the potential for the Sonora growing region is much higher than what will be harvested this season. “Sonora has the potential to harvest 23 million boxes in seven weeks (weeks 20-26),”says Pandol.
The grape industry in Mexico has been driven largely by two key factors, according to Pandol. One is the preference of retailers to hold back from rushing in to be first to market in new zones but stay with well matured late season grapes from the prior origin, like Chile in the Mexican season.
The other is the reduction of early season varieties like Perlettes and Flames and limited new varieties with which to replace them. “The halfway point for the Sonora season has typically been June 4. Now it’s more like June 12, in part due to the elimination of some of the early volumes,” Pandol said.
“Sometime in June retailers will decide the last week of desert grapes and the first week in Central California. The transition should occur sometime during weeks 28 and 29. By week 30 it’s 100% Central California,” he added.
In our ‘In Charts’ series, we work to tell some of the stories that are moving the industry. Feel free to take a look at the other articles by clicking here.
All pricing for domestic US produce represents the spot market at Shipping Point (i.e. packing house/climate controlled warehouse, etc.). For imported fruit, the pricing data represents the spot market at Port of Entry.
You can keep track of the markets daily through Agronometrics, a data visualization tool built to help the industry make sense of the huge amounts of data that professionals need to access to make informed decisions. If you found the information and the charts from this article useful, feel free to visit us at www.agronometrics.com where you can easily access these same graphs, or explore the other 21 commodities we currently track.