


Agronometrics in Charts: Commemorating ten years of the California Avocado Month


In this installment of the ‘Agronometrics In Charts’ series, Sarah Ilyas studies the state of the California avocado season. Each week the series looks at a different horticultural commodity, focusing on a specific origin or topic visualizing the market factors that are driving change.


The California Avocado Commission is commemorating a decade of June officially being California Avocado Month. In honor of the anniversary, the commission has enlisted Southern California native Chef Nyesha Arrington to create two seasonal recipes that feature California avocados.
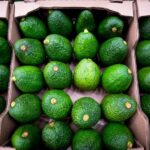
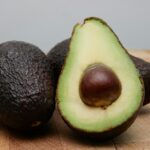
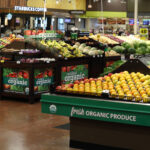
According to National Agricultural Statistical Service, the state of California grows roughly 90% of all the avocados in the United States. Most of the avocados grown here are the Hass variety, which is native to the state.
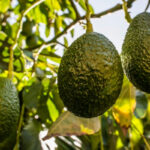
Avocados in California are a year-round crop, and while the average tree produces about 60 pounds of fruit, some trees can produce as much as 200 pounds in a single year.
The California Avocado Commission recently reported the results of their mid-season crop update surveys with their growers and handlers, forecasting a smaller crop than was initially expected.
The results forecast a 2022 California crop estimate at 286 million pounds – which consists of 272 million pounds of Hass, 8 million pounds of Lamb-Hass, 5 million pounds of GEM and 1 million pounds of other varieties.
This updated volume is a 20-million-pound reduction from the December 2021 handler pre-season estimate of 306 million pounds. The decrease in volume mostly comes from Hass (19 million pounds), however a slight reduction to the Lamb-Hass volume also has been made (1 million pounds).

Source: USDA Market News via Agronometrics. (Agronometrics users can view this chart with live updates here)
F.O.B. prices for avocados in general have been some of the highest on record this year.

Source: USDA Market News via Agronometrics. (Agronometrics users can view this chart with live updates here)
Source: USDA Market News via Agronometrics. (Agronometrics users can view this chart with live updates here)
The California Avocado Commission is extending its advertising campaign titled “the best avocados have California in them" according to a release. This season’s ads feature visuals that point to the “CA” in the middle of “avocados”, and audio and other ads that highlight the play on words in their taglines.
Consumer media is aimed at avocado shoppers in California and the West who are willing to pay more for premium brands and to avocado “super-users,” “mega-users” and “ultra-users," stated the release.
In our ‘In Charts’ series, we work to tell some of the stories that are moving the industry. Feel free to take a look at the other articles by clicking here.
All pricing for domestic US produce represents the spot market at Shipping Point (i.e. packing house/climate controlled warehouse, etc.). For imported fruit, the pricing data represents the spot market at Port of Entry.
You can keep track of the markets daily through Agronometrics, a data visualization tool built to help the industry make sense of the huge amounts of data that professionals need to access to make informed decisions.
If you found the information and the charts from this article useful, feel free to visit us at www.agronometrics.com where you can easily access these same graphs, or explore the other 21 commodities we currently track.


Subscribe to our newsletter


